Figure 3.
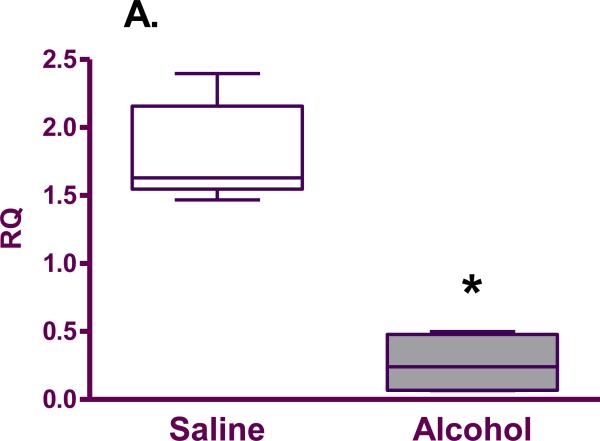
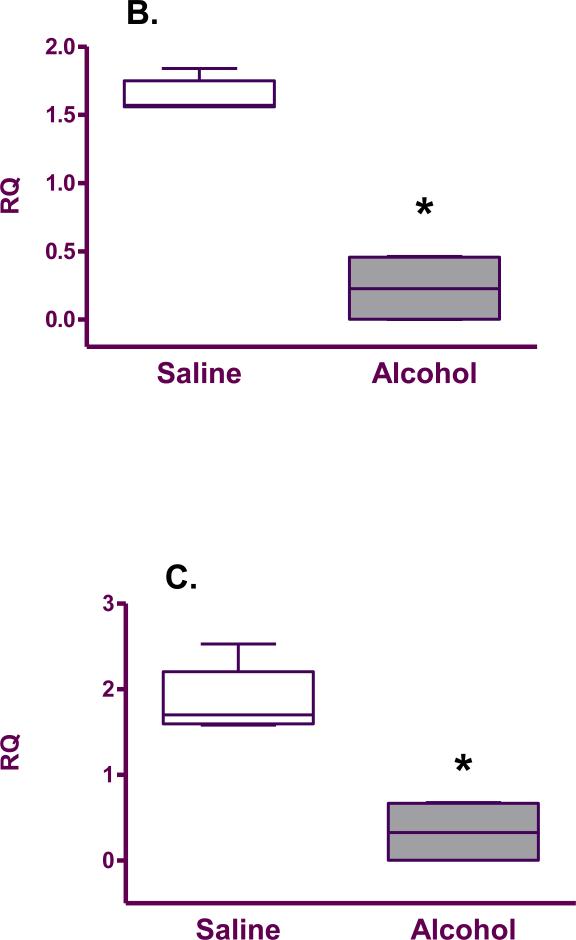
Antioxidant enzyme mRNA expression (relative quantity; RQ) in the fetal brain from saline (n=5) and alcohol-exposed (n=4) groups: A. SOD; B. GPx; C. CAT. The n is the number of litters. The box extends from the 25th percentile to the 75 percentile with a line at the median (the 50th percentile). Whiskers show the highest and the lowest values.*denotes statistically significant difference (p=0.02) between the groups.


