Figure 1.
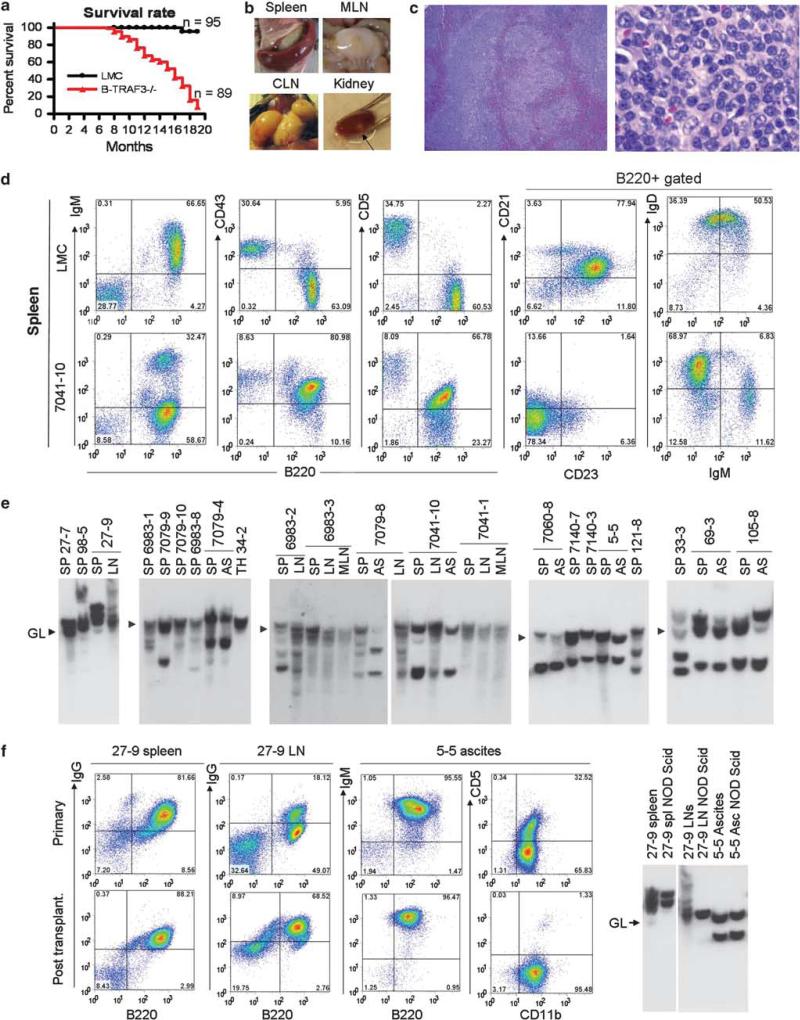
B-TRAF3–/– mice spontaneously developed B lymphomas. (a) Accelerated mortality of B-TRAF3–/– mice. Survival curves of LMC and B-TRAF3–/– mice are generated using the Kaplan-Meier method. P<0.001 as determined by the Mantel-Cox log-rank test. (b) Representative images of spleen, cervical lymph nodes (CLN) and mesenteric lymph nodes (MLN), and kidney of B-TRAF3–/– mice with B lymphomas. Arrow indicates a nodal B lymphoma in the kidney. (c) Representative photomicrographs of the spleen of moribund B-TRAF3–/– mice. Sections of the spleen of B-TRAF3–/– mice with B lymphomas were stained with hematoxylin and eosin. Right panel shows higher magnification of left panel. Normal architecture of the spleen was obliterated, and the red pulp was invaded by lymphoma cells. Lymphoma cells in the spleen had centroblast-like morphology with round or ovoid nuclei, and with prominent central nucleoli or two nucleoli adherent to the nuclear membrane. (d) Representative FACS profiles of the splenocytes of B-TRAF3–/– mice with B lymphomas. Splenocytes were stained with fluorochrome-conjugated B220, IgM, CD43, CD5, CD21, CD23 and IgD Abs, and then analyzed by a FACSCalibur. (e) Representative Southern blot analysis of IgH gene rearrangements of TRAF3–/– B lymphomas. Genomic DNA was prepared from the spleen (SP), ascites (AS), cervical lymph node (LN), mesenteric LN (MLN) or thymus (TH) of B-TRAF3–/– mice. DNA was digested with EcoRI, and hybridized with a JH4 probe. Germline bands (GL) are indicated by arrowheads. All bands of sizes different from the germline band are recombined IgH bands, representing clonal expansion of B-lymphoma cells. (f, g) Representative transplantation data of TRAF3–/– B lymphomas into NOD SCID mice. Spleen or LN cells (25 × 106) from mouse ID 27-9, or ascites (5 × 10⁶ cells) from mouse ID 5-5 were intraperitoneally injected into NOD SCID recipient mice. 8-12 weeks post transplantation, spleens, LNs and ascites were harvested from injected NOD SCID mice, and analyzed by FACS (f) and Southern blots of the IgH gene (g).

