Figure 5.
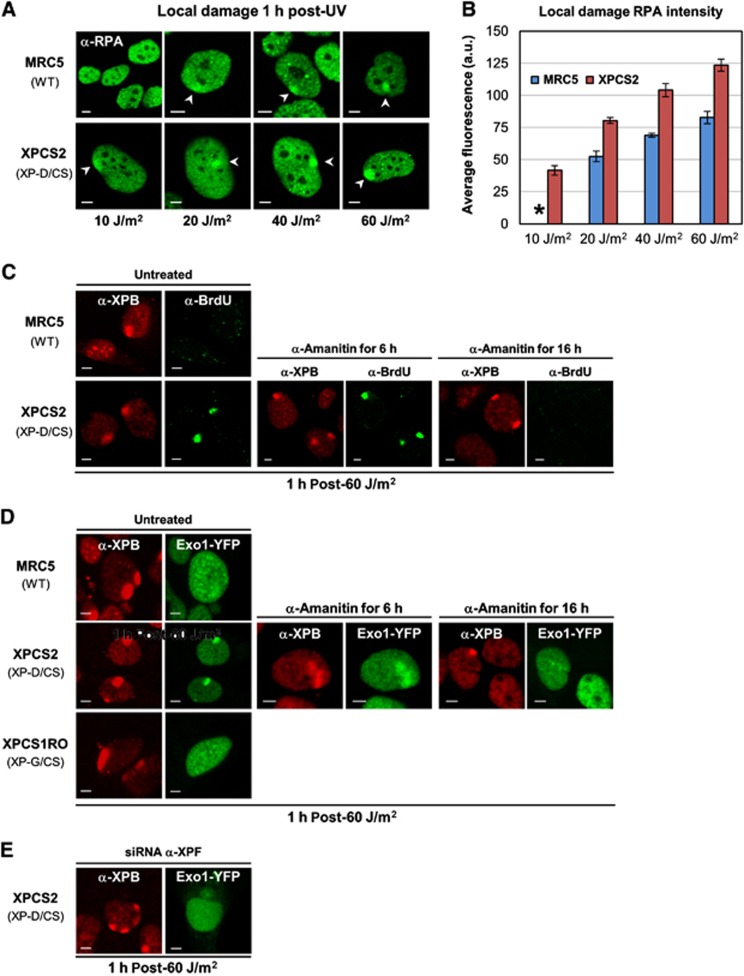
Single-strand DNA stretches are generated in XP-D/CS cells in response to UV. (A) Confocal images after RPA immunostaining in MRC5 and XPCS2 cells, 1 h after local UV irradiation (10–60 J/m2). (B) Bar graph showing the increasing levels of RPA accumulation in MRC5 (blue) and XPCS2 (red) cells as a function of increasing local UV exposure. The data were obtained by quantifying at least 10 localized RPA accumulations from images as shown in (A). The * at 10 J/m2 indicates an undetectable RPA accumulation signal in MRC5 cells. Vertical bars represent the s.e.m. (C) Confocal images of XPB (red) and BrdU (green) immunofluorescence in MRC5 (WT) and XPCS2 (XP-D/CS) cells, 1 h after local UV exposure (60 J/m2). Cells were either untreated, treated for 6 h with α-amanitin or for 16 h prior to UV exposure (left, middle and right panels, respectively). (D) Confocal images of XPB immunofluorescence (red) and Exo1-YFP (green) in MRC5 (WT), XPCS2 (XP-D/CS), and XPCS1RO (XP-G/CS) cells after local UV exposure (60 J/m2). Cells were either untreated, treated for 6 h with α-amanitin or for 16 h prior to UV exposure (left, middle, and right panels, respectively). (E) Confocal images of XPB immunofluorescence (red) and Exo1-YFP (green) in XPCS2 (XP-D/CS) after XPF depletion by siRNA silencing. All scale bars, 5 μm.

