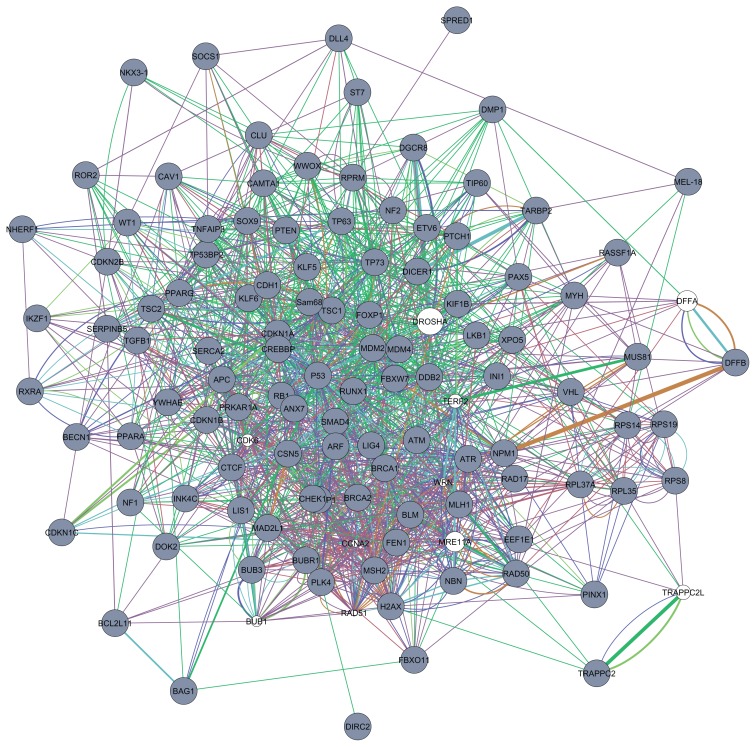
Figure 2.
Interactions among 109 haploinsufficient genes plotted using GeneMANIA plug-in available in Cytoscape.
Notes: Networking analysis of 109 genes by GeneMANIA algorithm revealed different type of interactions between them. Gray circles represent the queried genes, and white circles represent the predicted genes that mediate interactions. Color representations for edges: purple—co-expression, dark blue—physical interaction, green—genetic interaction, light blue—co-localization, and brown—predicted. The network consists of physical, genetic and predicted interactions which can be clearly seen.

