Figure 1.
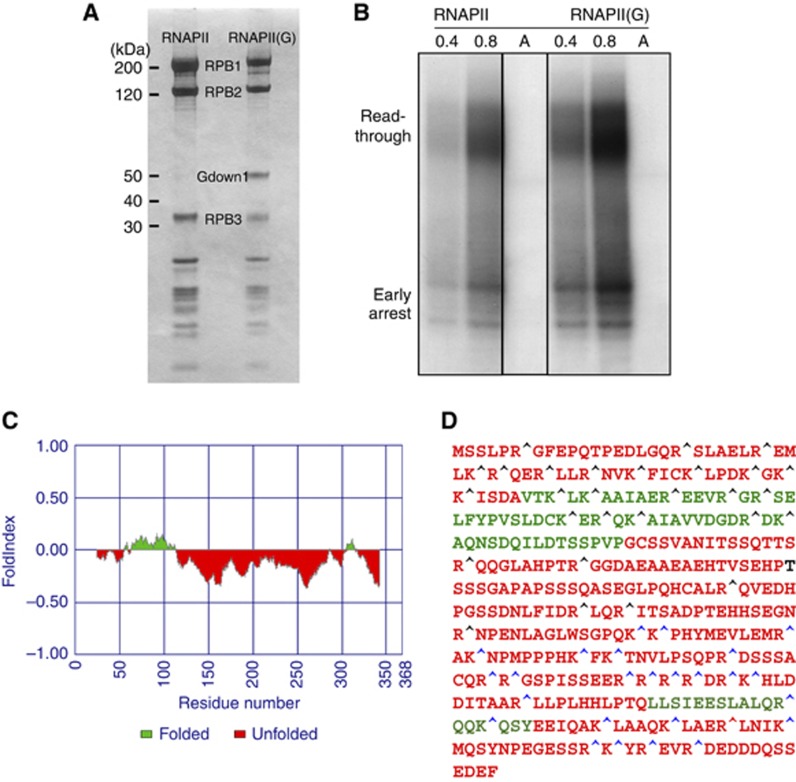
Biochemical and bioinformatics characterization of RNAPII(G). (A) Purification of native RNAPII and RNAPII(G). Both forms of calf thymus RNAPII are presented in the SDS–PAGE Coomassie stained gel, with Gdown1 and the RNAPII subunits Rpb1, Rpb2, and Rpb3 labelled. By dividing the integrated intensity over the respective molecular weight, the relative amounts of Rpb1, Rpb2, and Gdown1 in RNAPII(G) were determined to be 0.81: 1: 0.74. (B) Nonspecific transcription elongation assays. 0.4 and 0.8 μg of RNAPII (lanes 1–2) and RNAPII(G) (lanes 4–5) were used for the assays as previously described (Gnatt et al, 1997). RNA fragments from the early arrest or read-through are marked. As a control, α-amanitin, an RNAPII inhibitor, was added to RNAPII (lane 3) and RNAPII(G) (lane 6), respectively. All six lanes were from the same blot and only irrelevant lanes have been removed for the figure. Lanes 1 and 2 correspond to lanes 1 and 2 in the source gel; lane 3 corresponds to lane 4 in the source gel and lanes 4–6 correspond to lanes 6–8 in the source gel. The source data has been uploaded for full information. (C) Folding analysis of Gdown1. Program FoldIndex was used to evaluate the folding propensity of Gdown1. Two folded domains found are marked in green and unfolded region in red. (D) Limited proteolysis assay performed with trypsin. Single letter amino acid codes in the predicted folded region are denoted in green in contrast to the red colour for those in the predicted unfolded region. Cleavage sites of peptide fragments identified by mass spectrometry are labelled by blue carets while protected protease sites are denoted by black carets. Figure source data can be found with the Supplementary data.

