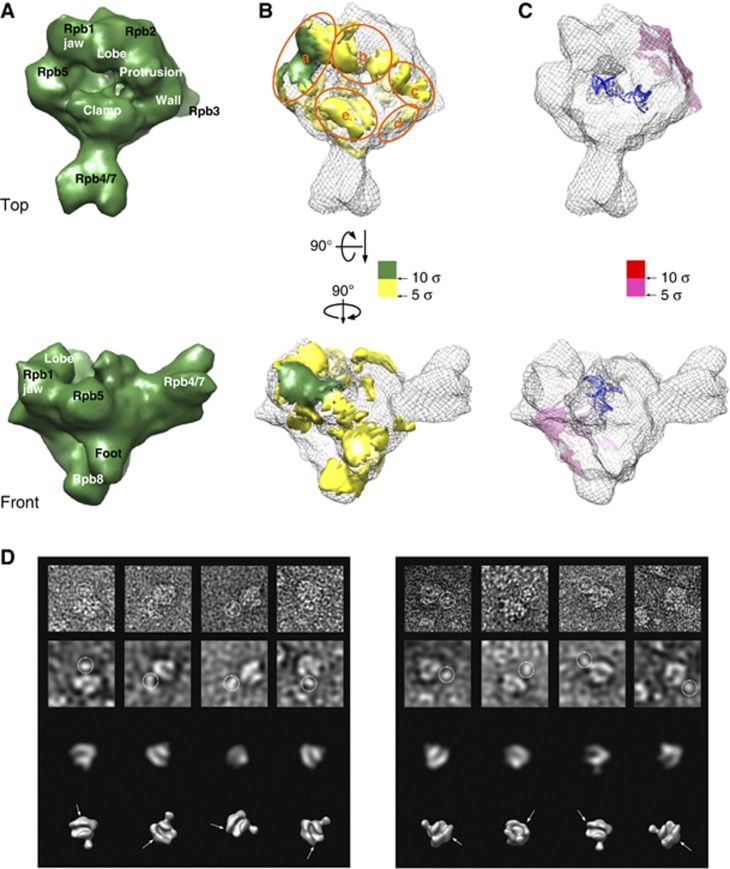
Figure 4.
Cryo-EM reconstruction of reconstituted bovine RNAPII–Gdown1 and antibody labelling experiments. (A) Front and top views of the cryo-EM reconstruction bovine RNAPII–Gdown1 elongation at ∼19 Å resolution (FRC 0.15) are depicted as solid deep green surface models. The threshold for rendering RNAPII–Gdown1 elongation is chosen based on a molecular weight of ∼560 kDa. (B) A positive difference map was calculated between the bovine RNAPII–Gdown1 elongation and bovine RNAPII elongation complex (grey mesh) by using volumes that were both filtered to 15 Å, and shown in yellow hue above 5 σ. The most conspicuous density above 10 σ is in the gap between the Rpb5 shelf and the Rpb1 jaw is shown in deep green. (C) A negative difference map was calculated between the bovine RNAPII–Gdown1 elongation and bovine RNAPII elongation complex and shown in pink hue. The additional densities attributed to the RNAPII elongation complex are likely to be the result of conformational changes (outer densities). (D) The right panel presents RNAPII–Gdown1 EM analysis with a polyclonal antibody against Gdown1 (gift from Dr David Price, University of Iowa, USA). From top to bottom are raw negative-stained images, images filtered to 50 Å to reveal RNAPII gross features, matching projections of RNAPII at 50 Å, and the corresponding 3D models. The left panel shows a similar analysis employing a monoclonal antibody recognizing GST, fused to the N-terminus of Gdown1. Antibody densities are encircled in the top rows, and their location denoted with arrows in the lower 3D models.

