Figure 5.
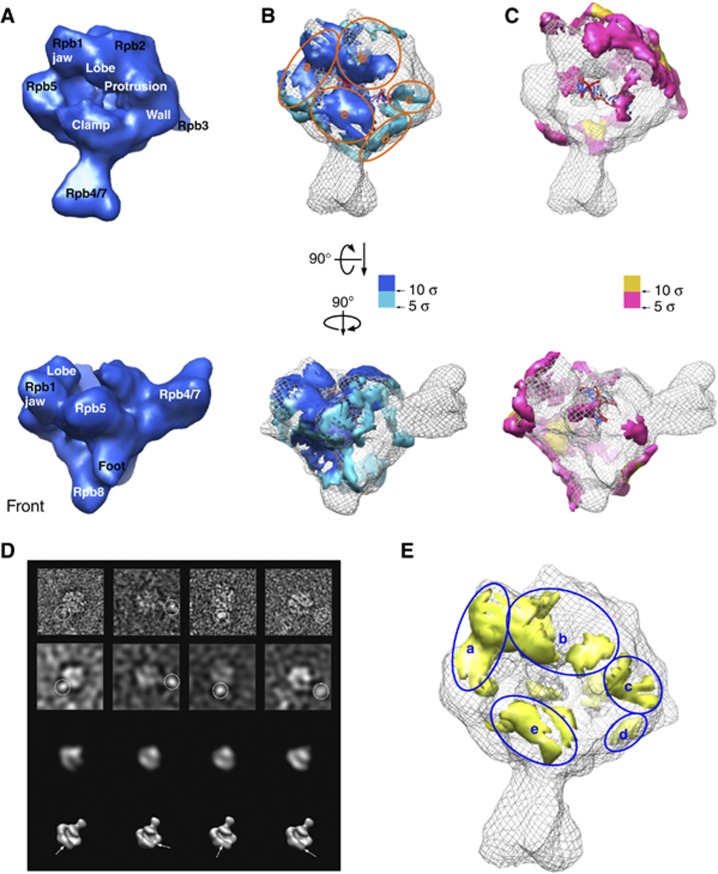
Cryo-EM reconstruction of RNAPII–TFIIF. (A) Top and front views of the cryo-EM reconstruction of bovine the RNAPII–TFIIF elongation complex at a resolution of ∼19 Å (FRC 0.15). The threshold for rendering the complex is chosen based on the total mass of the complex (∼620 kDa). (B) A positive difference map in blue hue is overlaid on the RNAPII elongation complex (grey mesh). The difference was obtained by subtracting RNAPII with nucleic acids from RNAPII–TFIIF with nucleic acid, both filtered to 15 Å. (C) A negative difference map in red hue is overlaid on the RNAPII elongation complex (grey mesh). (D) RNAPII–TFIIF images with a monoclonal antibody recognizing the GST fused to the N-terminus of TFIIF. From top to the bottom are raw negative-stained images, images filtered to 50 Å to reveal RNAPII gross features, matching projections of RNAPII at 50 Å, and the corresponding 3D models. (E) Common, overlapping regions attributed to both Gdown1 in Figure 4B (green) and regions attributed to TFIIF in Figure 5B (blue) are shown in yellow.

