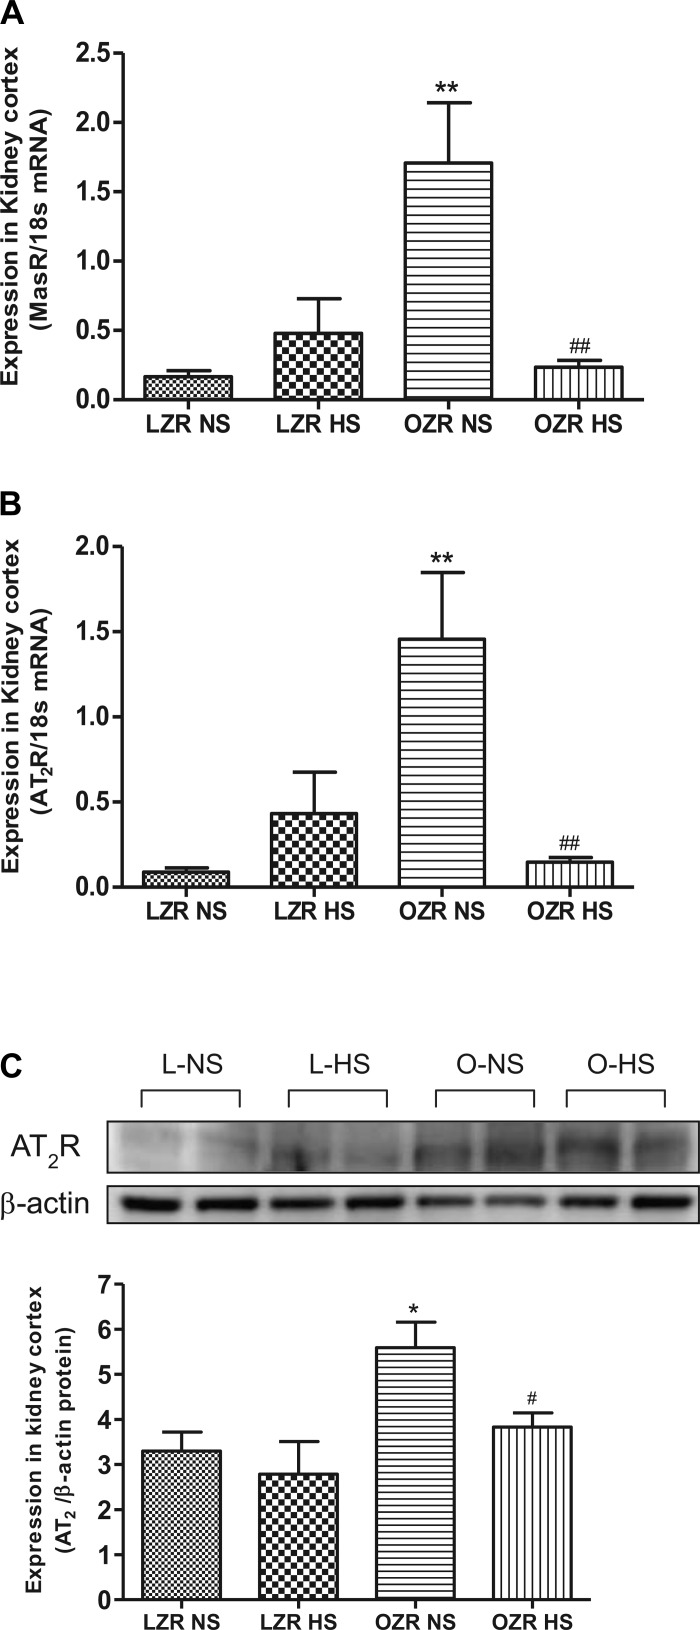
Fig. 4.
Expression of Mas receptor (MasR) and AT2R in NS- and HS-fed LZR and OZR. A: quantitative expression pattern of MasR gene. B: quantitative gene expression of AT2R. C: Western blot analysis of AT2R. Data were analyzed using 1-way ANOVA with a Newman-Keuls post hoc test; n = 6–7/group. *P < 0.05, **P < 0.01 compared with LZR NS. #P < 0.05, ##P < 0.01 compared OZR NS.

