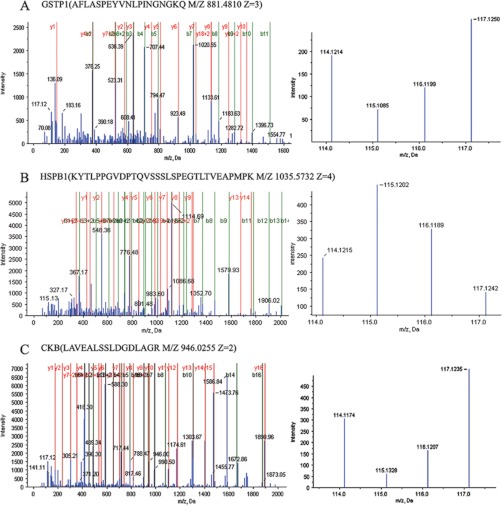
Fig. 1.
MS/MS spectra used for the identification and quantitation of GSTP1, HSPB1 and CKB. A, (left) the sequence AFLASPEYVNLPINGNGKQ allows the identification of GSTP1; (right) the released iTRAQ reporter ions provide the relative quantitation of GSTP1 from the four tissues evaluated. B, (left) the sequence KYTLPPGVDPTQVSSSLSPEGTLTVEAPMPK allows the identification of HSPB1; (right) the released iTRAQ reporter ions provide the relative quantitation of HSPB1 from the four tissues evaluated. C, (left) the sequence LAVEALSSLDGDLAGR allows the identification of CKB; (right) the released iTRAQ reporter ions provide the relative quantitation of CKB from the four tissues evaluated. NBE, labeled with iTRAQ reagent 117; SM, labeled with iTRAQ reagents 114, AH/CIS, labeled with iTRAQ reagent 116; and invasive LSCC, labeled with iTRAQ reagent 115.

