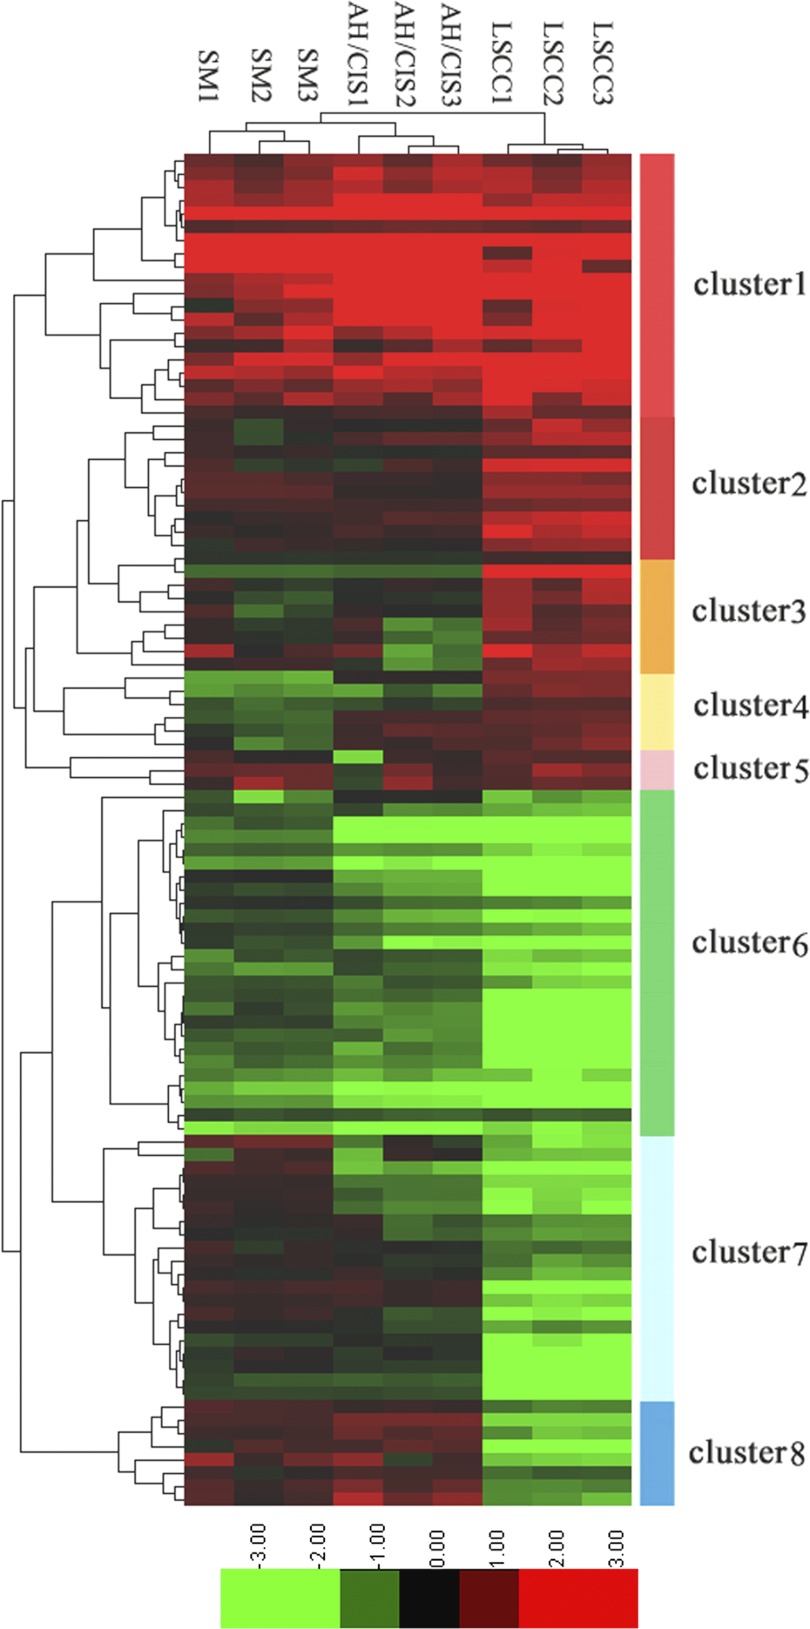
Fig. 6.
Hierarchical clustering of 102 differentially expressed proteins. Log2 of normalized counts of differential proteins were clustered. Red clusters denote high levels of expression whereas light green clusters denote low levels of expression. The x axis represents the samples whereas the y axis represents the proteins. The panel on the right shows the 8 different clusters. SM, AH/CIS, and LSCC represent SM, AH/CIS, or LSCC versus NBE, respectively.

