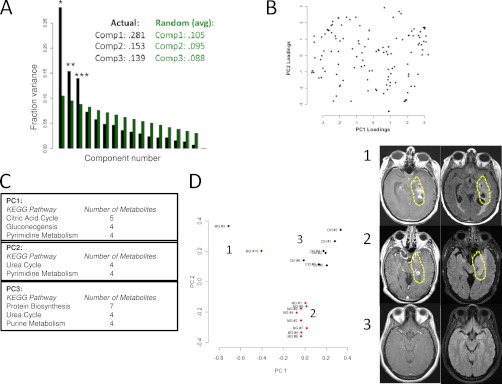
Fig. 3.
Principal component analysis (PCA) of CSF metabolite composition. A, Fraction of variance explained (Fraction variance) plotted across principal component number. Black bars indicate values obtained from measured data. Green bars indicate average values obtained from a PCA analysis of n = 100,000 random, normally distributed data of dimension, mean, and variance equivalent to the measured data. Numerical values of the first three components are shown in the caption for each case. *denotes p = 8.3e-15, ** denotes p = 2.6e-5, *** denotes p = 1.8e-9. p values were obtained from Monte Carlo simulations. B, Loadings plot obtained from the PCA analysis. Coefficients of eigenvectors for the first and second principal components are shown. C, Kegg pathway analysis of the first three significant princpal components. The first column lists the pathway and the second column lists the number of metabolites identified within the pathway for the top 40 coefficients in magnitude for each principal component. Abbreviations: Phe, Phenylalanine; Tyr, Tyrosine; Ala, Alanine. D, (left) Projection of individual samples onto the first two principal components. Colors correspond to cluster membership as assigned by k-means clustering with k = 3. Samples from malignant glioma patients segregate into two groups and the control samples segregate into a separate group. (right) Representative MRI images of the Tumors from patients in group 1 and group 2.

