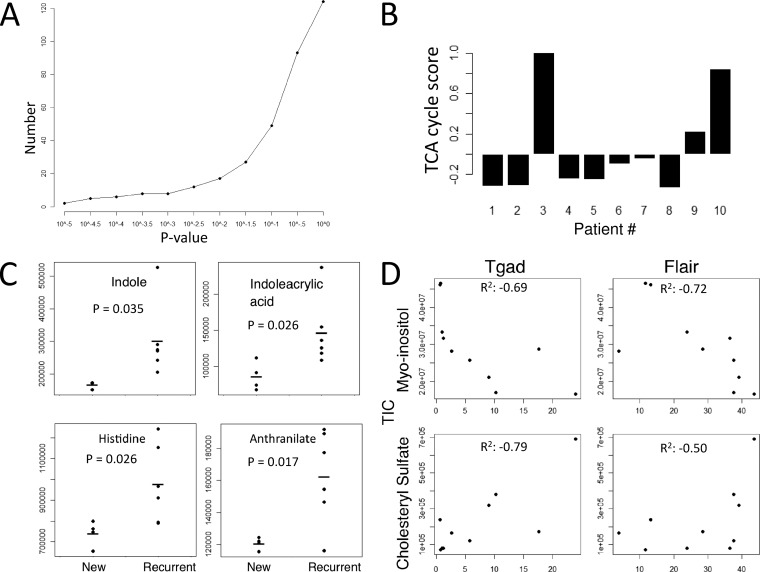
Fig. 4.
Metabolite signatures of GBM subtypes and correlations with clinical parameters. A, Number of metabolites that change in the CSF of malignant glioma samples relative to the control patients as a function of p value cutoff using a two-tailed t test statistic. B, TCA cycle signature associated with patients 3 and 10 and its relative contribution across patient samples. Signature score is defined as the normalized sum of metabolite intensity of the citric acid cycle components (succinate, fumarate, alpha-ketoglutarate, malate, oxaloacetate, isocitrate, and citrate). C, Tryptophan metabolism intermediates associated with recurrent disease (p value < 0.05). D, Example metabolites cholesteryl-sulfate and myo-inositol that positively and negatively correlate (R2) with tumor size as measured with MRI using Tgad and FLAIR (x axis) and correlated with the integrated total ion current (TIC) peak areas (y axis) obtained from targeted LC-MS/MS measurements.

