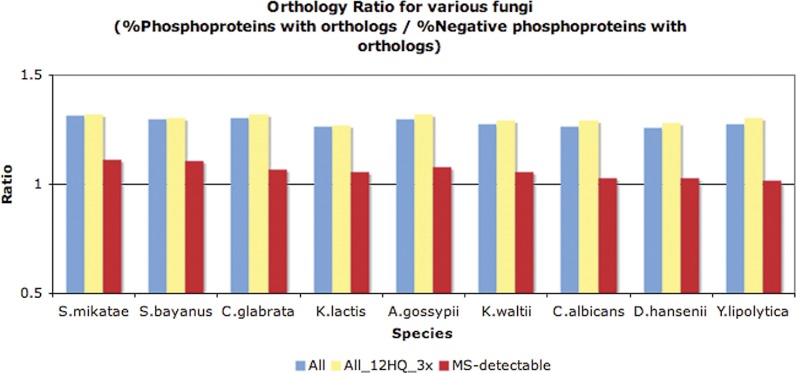
Fig. 6.
Orthology ratio for various fungi (orthologs based on phylogeny and YGOB) for the 12HQ versus negative data set (blue color), for the 12HQ_3x versus negative data set (yellow color) and the MS-detectable 12HQ versus negative data set (red color). A ratio value >1 indicates that phosphoproteins have more yeast orthologs than the negative data set, in that particular fungus.

