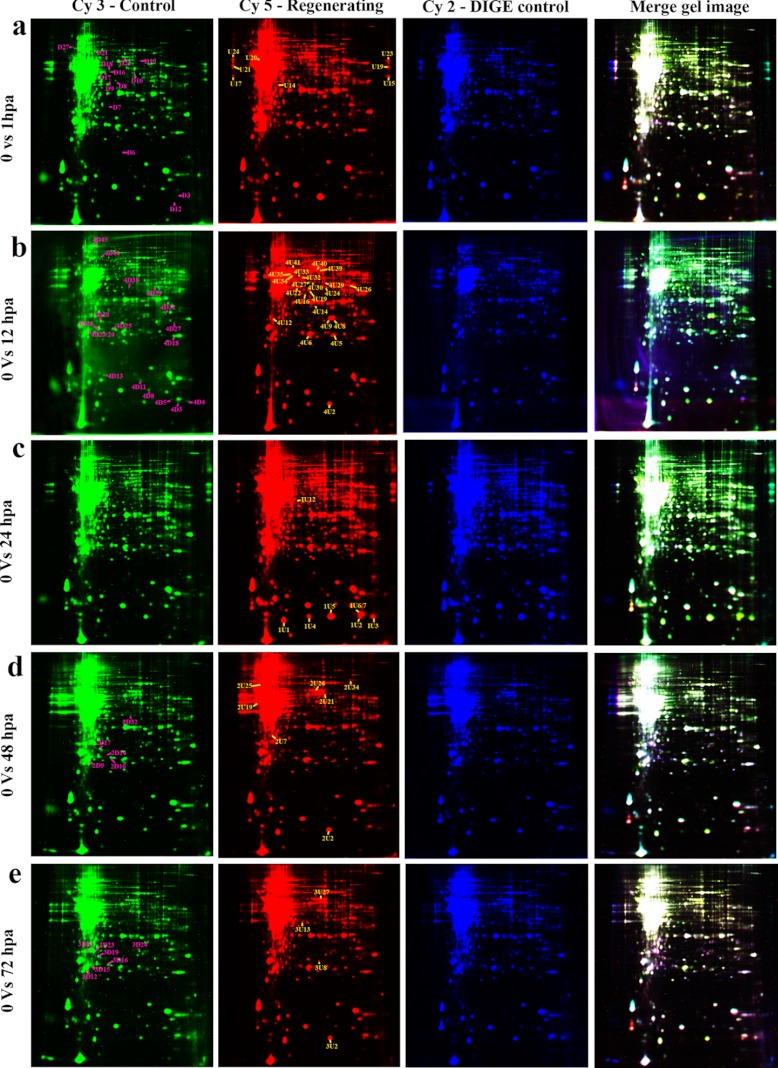
Fig. 1.
2DE DIGE map of zebrafish caudal fin. a, control (0 hpa) versus 1 hpa; b, control versus 12 hpa; c, control versus 24 hpa; d, control versus 48 hpa; e, control versus 72 hpa. Control (0 h) samples are labeled with Cy3 dye (green 2DE images), regenerating samples are labeled with Cy5 dye (red 2DE images), and internal standard combining the protein from control and regenerating tissues are labeled with Cy2 dye (blue 2DE images). The overlays of all three dyes are represented as multicolored 2DE images. The down-regulated proteins are represented in the green 2DE images with pink labeling, and up-regulated proteins are represented in the red 2DE images with yellow labeling.

