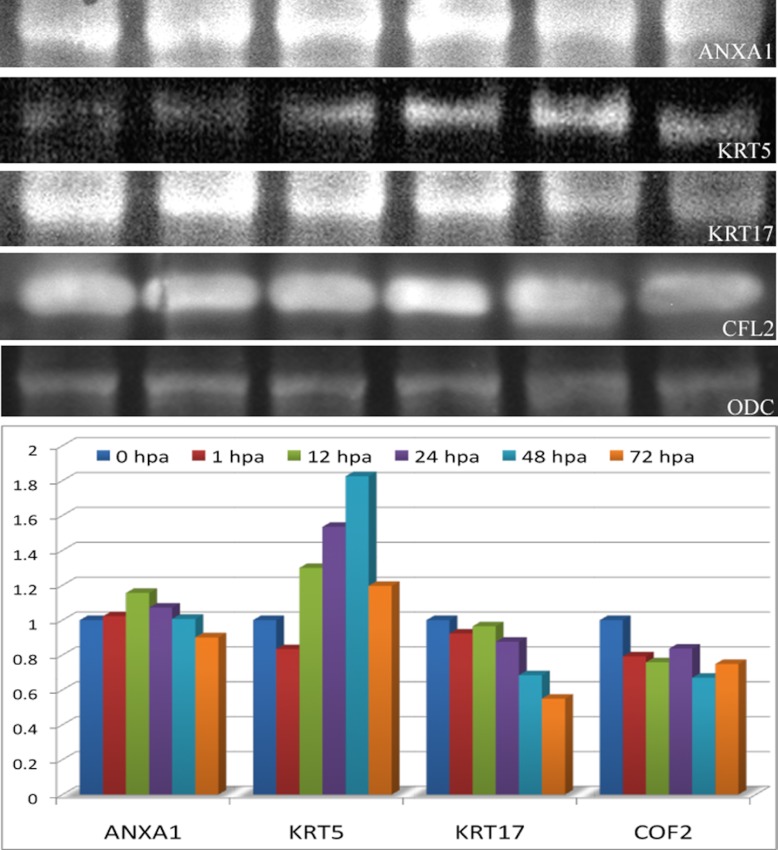
Fig. 9.
Western blot analysis showing the expression of ANXA1, KRT5, KRT17, CFL2, and ODC. The lower panel of the figure represents the relative expression of ANXA1, KRT5, KRT17, and CFL2 normalized against the ODC protein expression. The distribution was represented as a relative expression against the control 0 hpa.

