Fig. 1.
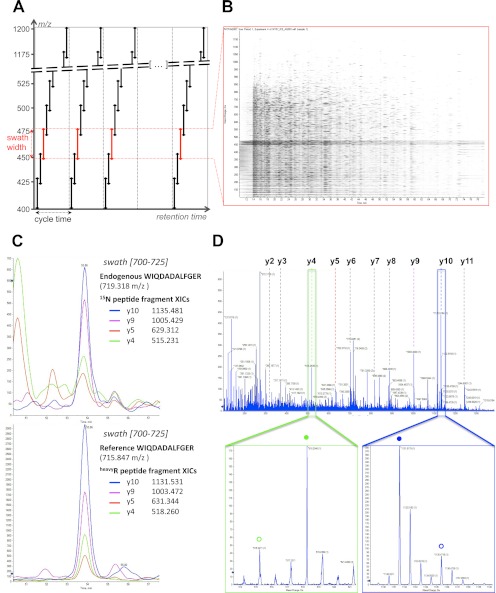
SWATH MS data-independent acquisition and targeted data analysis. A, the data-independent acquisition method consists of the consecutive acquisition of high resolution, accurate mass fragment ion spectra during the entire chromatographic elution (retention time) range by repeatedly stepping through 32 discrete precursor isolation windows of 25-Da width (black double arrows) across the 400–1200 m/z range. The series of isolation windows acquired for a given precursor mass range and across the LC is referred to as a “swath” (e.g., series of the red double arrows). The cycle time is defined as the time required to return to the acquisition of the same precursor isolation window. Note that the dotted line before the beginning of each cycle depicts the optional acquisition of a high resolution, accurate mass survey (MS1) scan. B, representation of the actual data acquired in one swath (450–475 m/z range) shown here as an MS2 map, with retention time as the abscissa, fragment ion m/z as the ordinate, and ion intensity represented by color intensity. The darker horizontal band visible between 450 and 475 m/z corresponds to residual precursor ions for this swath. The signals co-eluting in the vertical direction are likely fragment ions originating from the same precursor ion. C, the targeted data analysis consists of retrieving the most intense fragment ions of a peptide of interest from a spectral library (list of fragment masses for the 15N-labeled peptide WIQDADALFGER or the corresponding C-terminal isotopically labeled reference) and extracting those fragment ion traces in the appropriate 700–725 swath using a narrow m/z window (e.g., 10 ppm). These fragment ion traces can be plotted as overlaid extracted ion chromatograms, similarly to SRM transitions. The peak group displaying the best co-eluting characteristics and matching best to the peak group of extracted reference fragment ion traces identifies and quantifies the target peptide. D, the complete high resolution, accurate mass fragment ion spectra underlying the best candidate peak group can be extracted from the raw data. These spectra can be inspected to confirm that the extracted signals originate from mass accurate monoisotopic fragment ion with the right charge state (e.g., lower panel zooms on the y4 (green box) and y10 (blue box) fragment, with the endogenous and reference peptide fragments annotated with open or closed circles, respectively). They can also be extensively annotated to strengthen the identification of the peptide (top panel).

