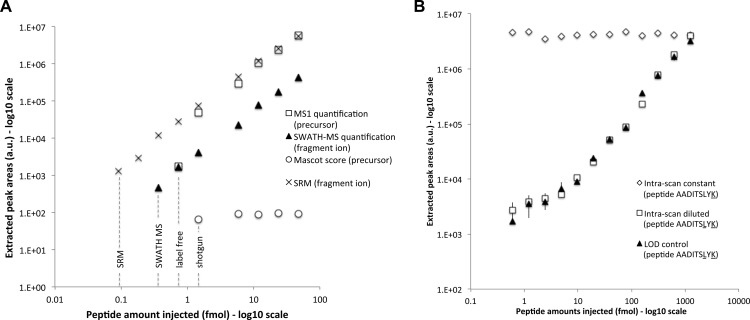
Fig. 3.
Limit of detection and intrascan dynamic range. A, the areas (y axis) of the precursor ion extracted from the survey scan (open squares) and of the most intense fragment ion extracted from the SWATH MS (closed triangles) and SRM (black crosses) quantifications are shown for the different serial dilution experiments (injected amounts of the peptide ELGQSGVDTYLQTK diluted in a yeast tryptic background in the x axis). The Mascot scores of the peptide identified in the same dilution series samples but acquired in DDA mode are shown as open circles. The limits of detection for the different methods are indicated with dotted lines. The complete series of LOD plots and corresponding lists of peak areas for the precursor and fragment ion traces quantified during these dilution series experiments are provided in supplemental Table 1 for the full set of 61 reference peptides. B, similar quantification plot for the doubly isotopically labeled peptide AADITSLYK serially diluted in a yeast tryptic background is shown here for the most intense fragment ion with closed triangles (“LOD control”). The intrascan dynamic range experiment consists of a dilution series of the same peptide AADITSLYK (open squares, “intrascan diluted”) in the presence of a constant amount of a singly isotopically labeled peptide AADITSLYK (open diamonds, “intrascan constant”), in the same yeast tryptic background. The complete lists of peak areas for the precursor and fragment ion traces quantified during the dilution series and intrascan dynamic range experiments are provided in supplemental Table 2. Screenshots of the quantified fragment ion traces and of the MS/MS spectra (zoomed around the y7 fragment) underlying the peptide peak apex are provided in supplemental Fig. S6 for the sample sets of the intrascan dynamic range experiment.

