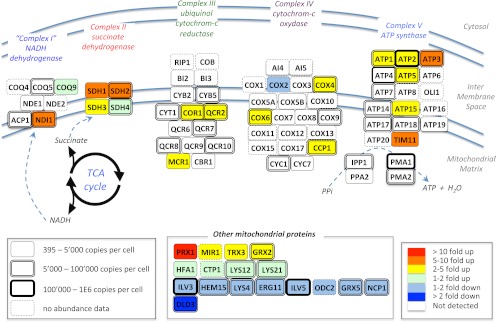
Fig. 5.
Extended quantification by SWATH MS of the abundance fold changes of mitochondrial enzymes during a diauxic shift experiment. Schematic representation of the respiratory chain and oxidative phosphorylation networks inspired by the Kyoto Encyclopedia of Genes and Genomes pathway representation (47). The abundance fold changes of the enzymes quantified by SWATH MS are coded with colors. The box shapes are indicative of the absolute abundances of the proteins with the same notices as those mentioned in Fig. 4. The complete list of peptides and of their fragment ions used to quantify those proteins, as well as the peak areas and corresponding protein abundance fold changes are provided in supplemental Table 7.

