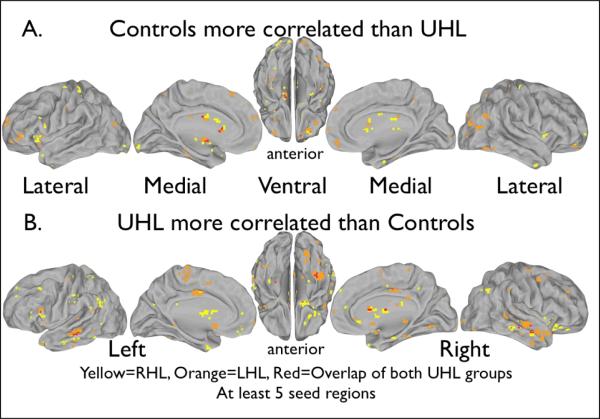
Figure 3.
Conjunction analysis maps showing locations of BOLD signal fluctuation correlations that differ between the UHL groups and the control group. Red indicates locations that differed from controls in both the right and left UHL groups. Yellow indicates differences from controls in the right UHL group alone, and orange shows differences from controls in the left UHL group. At least five seed regions contributed to the differences shown. Table 3 shows the seed regions that were found to contribute to each location. (A) The control group had higher correlations with the seed regions than the UHL groups. (B) The UHL groups had a higher correlation with the seeds regions than the control group.

