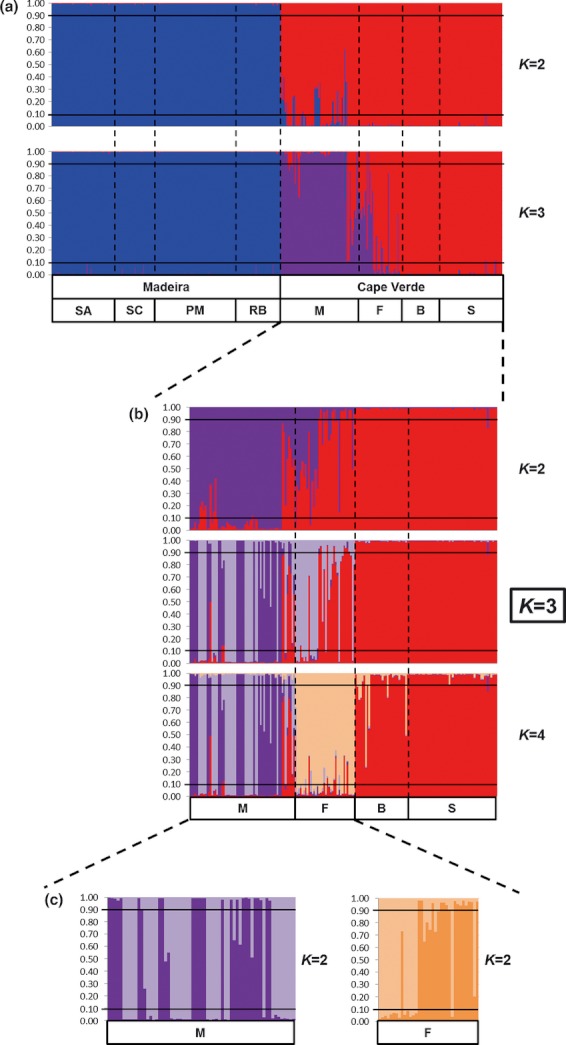
Figure 3.

Bayesian cluster analysis conducted by STRUCTURE at three different levels. (a) all samples, (b) Cape Verde samples, (c) Maio and Fogo islands. K, number of clusters. Columns correspond to the multilocus genotype of each individual, partitioned in different colors representing the probability of ancestry (qi) to each cluster. Individuals were ordered according to their geographic information. Lines indicate the qi threshold used to determine admixed individuals (see Methods).
