Figure 5.

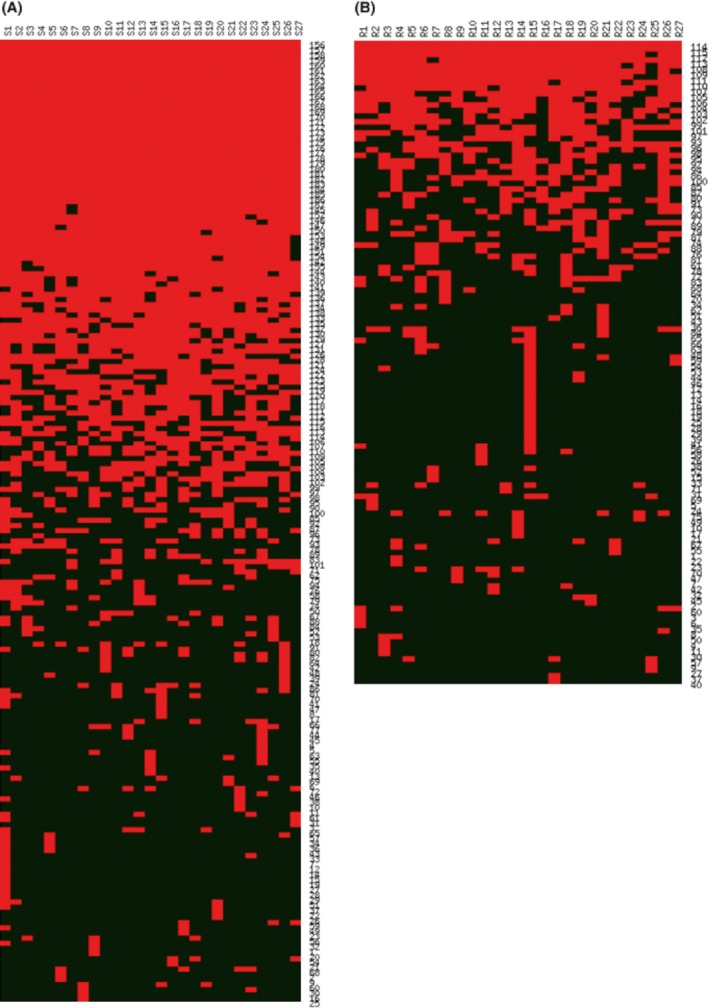
Heat map showing clustering of fungal families in (A) soil and (B) root samples. The color code of the heat map indicates presence (red) or absence (black) of fungal families (in rows) in the individual samples (in columns).

Heat map showing clustering of fungal families in (A) soil and (B) root samples. The color code of the heat map indicates presence (red) or absence (black) of fungal families (in rows) in the individual samples (in columns).