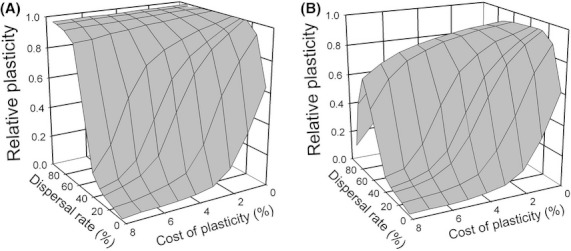
Figure 2.

The interaction of dispersal rate and cost of plasticity on the evolution of phenotypic plasticity, where the cost is scaled as the percentage decrease in fitness for an individual expressing the optimal reaction norm. In these simulations dispersal rate was a fixed trait and loci were unlinked. (A) Selection before dispersal (select first). (B) Dispersal before selection (move first). A value of 1.0 for relative plasticity indicates a pure plasticity outcome.
