
Figure 3.
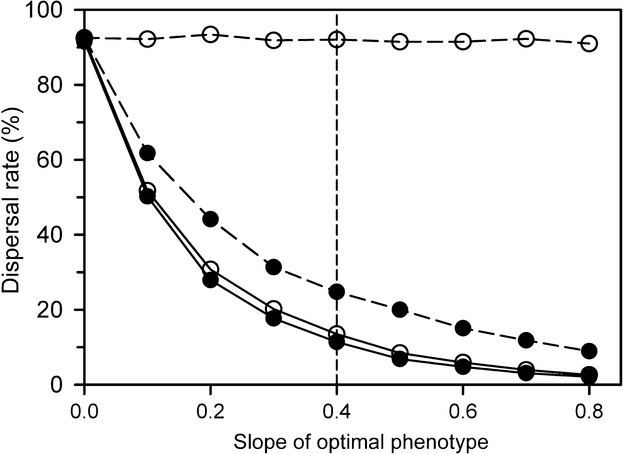
The evolution of dispersal rate with varying amounts of environmental heterogeneity (the slope of the gradient of optimal phenotypes) when only genetic differentiation is possible (no plastic loci, solid symbols) or when only plasticity is possible (no non-plastic loci, open symbols). Solid lines indicate dispersal before selection (move first); dashed lines indicate selection before dispersal (select first). For these simulations, there was no cost of plasticity. The vertical dashed line indicates the slope used in the other simulations in this paper.