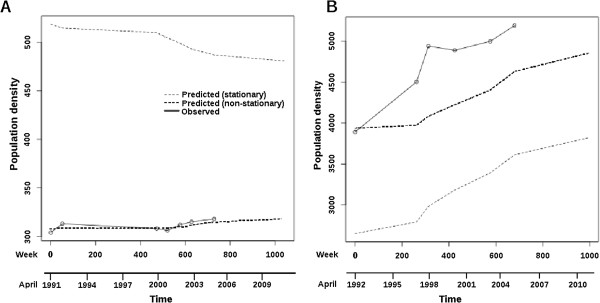
Figure 2 .
Plots of population density against sampling time for A, Ban Khi Lek and B, Mahaxai. The original observations are plotted, as well as GSS model predicted values for both the stationary and non-stationary cases. Time was measured in weeks, but an additional scale in years is given for convenience.

