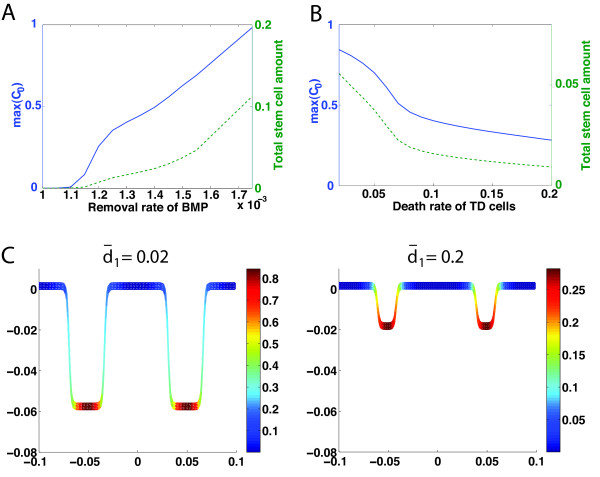
Figure 4.
Maximal density and total amount of progenitor cells on a crypt as functions of removal rate of BMP or maximal death rate of TD cells. (A) Blue: removal rate of BMP versus maximal density of progenitor cells (max (C0)); green: removal rate of BMP versus total amount of progenitor cells. (B) Blue: maximal death rate of TD cells () versus maximal density of progenitor cells (max (C0)); green: maximal death rate of TD cells versus the total amount of progenitor cells. (C) Spatial distribution of progenitor cells and the spatial crypt pattern at and 0.2. Other parameters used for the simulation are in Additional file 1: Table S2.

