Figure 6.
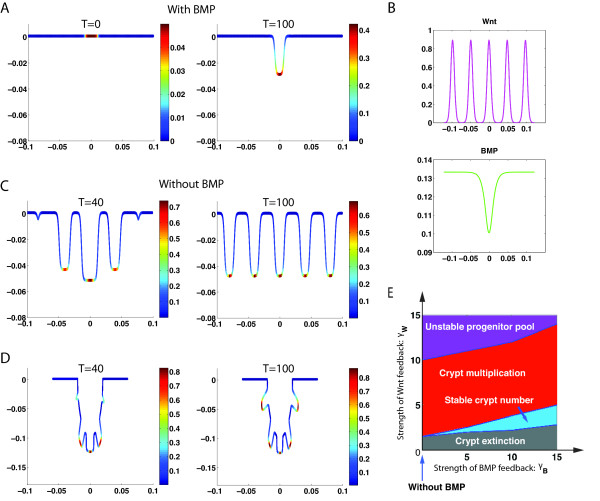
Dynamics of crypts with or without BMP. (A) With BMP, starting from a uniform distribution of progenitor cells localized in a small local area of the tissue (T = 0), a single crypt is formed near the steady state (T = 100) (μ1 = 2.5 × 10⁻⁴s−1μM). (B) The corresponding patterns of Wnt and BMP near the steady state in the crypt system described in (A). (C) If BMP is removed, starting from the single crypt (T = 100 in (A)), more small crypts are generated (T = 40) and eventually give rise to five identical crypts (T = 100). (D) Dynamics of crypt multiplication using a different energy function E without BMP (see Eq. S1.5 in Additional file 1). (E) A phase diagram of crypts in terms of γB and γW the strengths of feedback for Wnt and BMP, respectively. “Crypt extinction” corresponds to zero density of progenitor cells at the steady state; “Stable crypt number” means the number of crypts at the steady state is equal to the number of the initially localized spots of progenitor cells (e.g. se T = 100 in (A)); “Crypt multiplication” stands for the number of steady crypts increases from “stable crypt number” (e.g. T = 100 in (C) and (D)); “Unstable progenitor pool” represents the region where the density of progenitor cells in multiple crypts increases without bounds. Other parameters used are listed in Additional file 1: Table S2.

