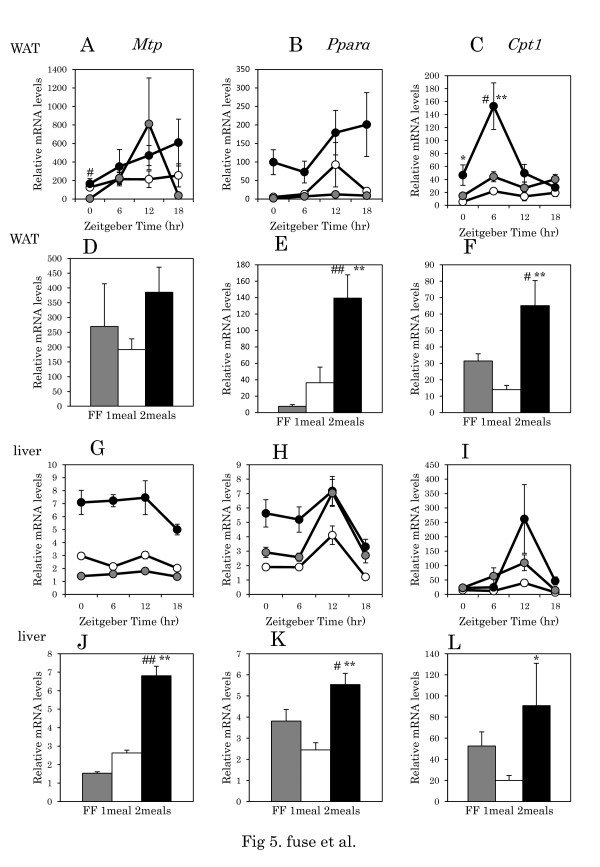
Figure 5.
β-oxidation related gene expression in WAT and liver tissues in mice with one meal or two meals.A, B, C: Daily pattern of Mtp, Pparα, and Cpt1 mRNA levels in WAT, respectively. G, H, I: Daily pattern of Mtp, Pparα, and Cpt1 mRNA level in liver, respectively. D, E, F, J, K, L: Columns show the average level of gene expression throughout the day. Data are presented as mean ± SEM values (FF, n = 16; one meal, n = 20; two meals, n = 19). Y-axis: the relative levels of each data set are normalized to the corresponding Gapdh mRNA levels. The number of mice at each time point was 4–6 for each group. Gray circle and column: FF; white circle and column: one meal; black circle and column: two meals. ## p < 0.01, #p < 0.05 vs. FF, * p < 0.05, ** p < 0.01 vs. one meal (Tukey-Kramer test).

