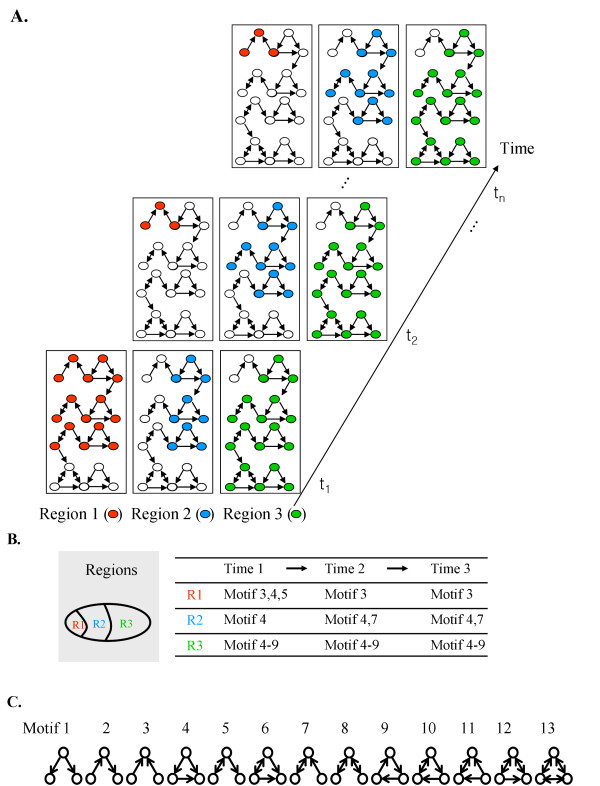
Figure 1.
Conceptual illustration of a spatiotemporal sequence of network motifs. (a) A network featuring spatiotemporal variations. Red, blue, and green circles denote the nodes in active sub-networks of regions 1, 2, and 3, respectively. Filled and unfilled circles denote active and inactive nodes, respectively. (b) Illustration of a spatiotemporal sequence of network motifs in nine active sub-networks. Each region-specific network has its own network motifs and the occurrence of the network motifs changes over time. (c) Thirteen possible three-node sub-network structures.

