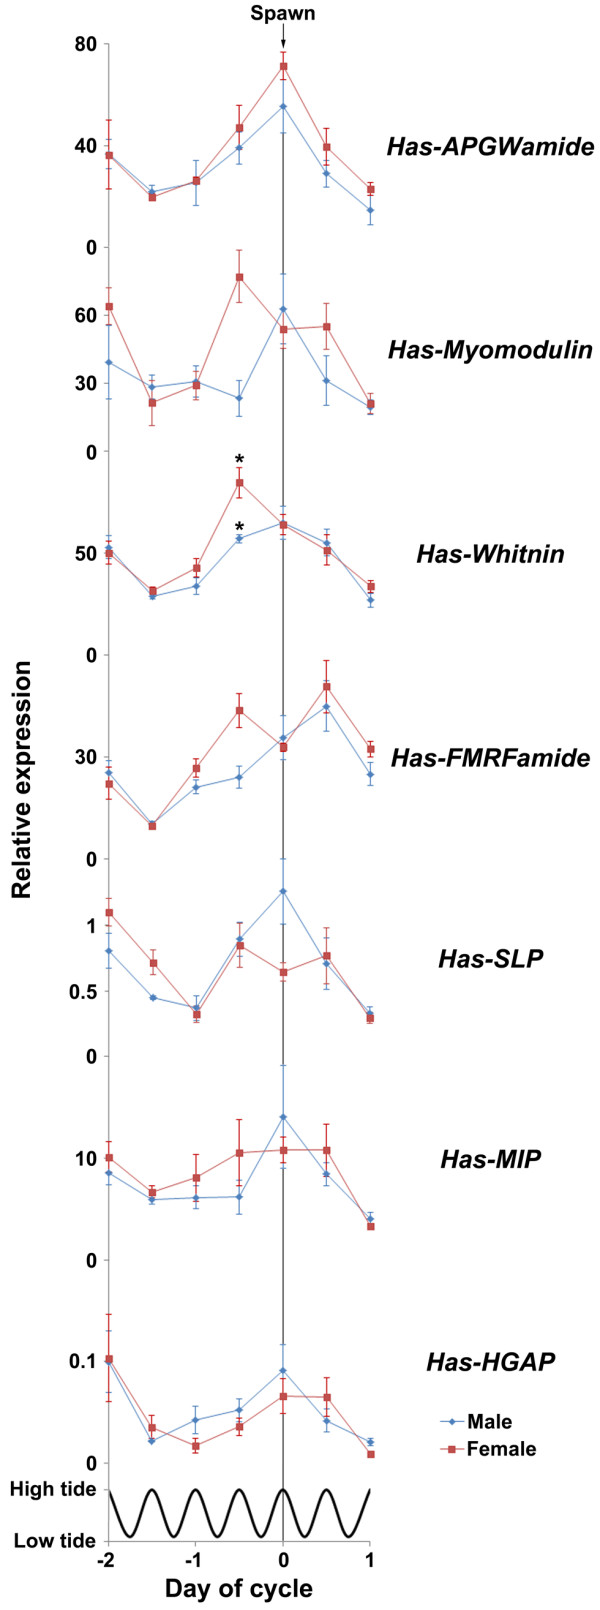
Figure 6.

Comparison of quantitative PCR expression profiles surrounding the spawning event. Male expression shown in blue (N = 4 anterior ganglia/data point), female expression shown in red (N = 4 anterior ganglia/data point). Error bars display standard error of the mean. Asterisks indicate a significant difference in expression between genders for the indicated timepoint. Tidal cycle is shown; all timepoints were taken at high tide.
