Figure 1.
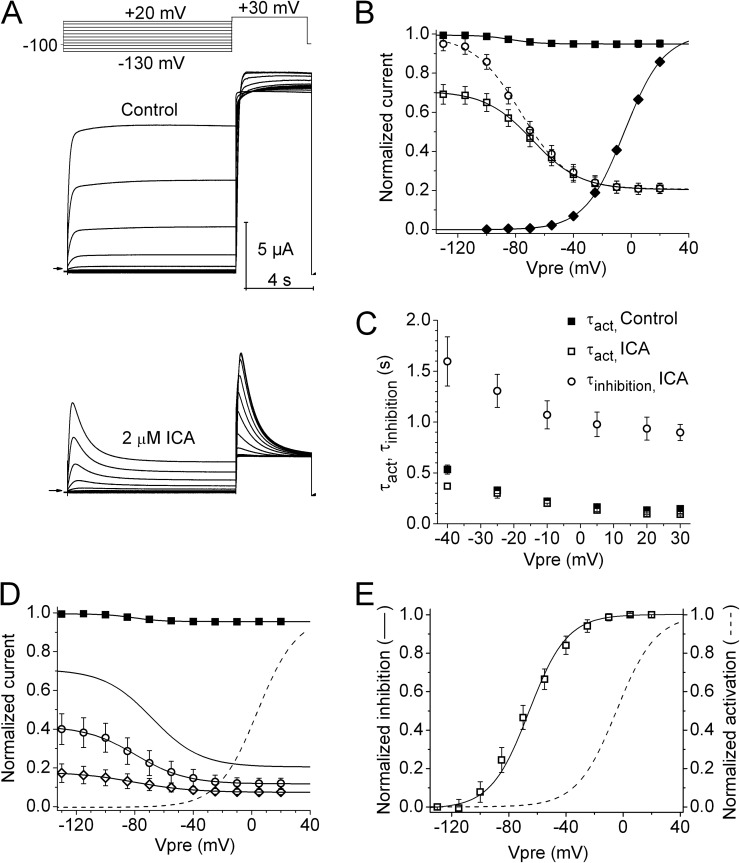
Intrinsic inactivation of hEAG1 channels is enhanced by ICA. (A) hEAG1 currents recorded before (Control, middle) and after 2 µM ICA (bottom) using the voltage-pulse protocol shown in the top. Vh was −100 mV, and Vpre was 10 s in duration and ranged from −130 to +20 mV, applied in 15-mV increments. After each Vpre, a test pulse was applied to +30 mV. Zero current level is indicated by an arrow on the bottom left of the current traces in this panel and in all other figures. (B) Voltage dependence of hEAG1 activation (control, ◆) and inactivation in the absence (■) and presence of 2 µM ICA (□). For inactivation curves, normalized Imax was plotted as a function of Vpre. For the activation curve, Ipre normalized for electrical driving force was plotted as a function of Vpre. Data (n = 7) were fitted with a Boltzmann function (curves). For control inactivation, V0.5 = −81.4 ± 3.5 mV and z = 1.49 ± 0.32; for control activation, V0.5 = −4.6 ± 0.7 mV and z = 1.83 ± 0.06. For inactivation in the presence of ICA, V0.5 = −66.0 ± 4.1 mV and z = 1.15 ± 0.15. ○, extrapolated Imax in the presence of 2 µM ICA: V0.5 = −73.3 ± 3.9 mV and z = 1.11 ± 0.16. (C) Plot of time constants for onset of activation (control, ■; 2 µM ICA, □) and inactivation (2 µM ICA, ○) during the 10-s Vpres (n = 8). (D) Voltage dependence of inactivation in the absence and presence of three concentrations of ICA. The normalized Imax–Vpre relationship for the test pulse is plotted for control (■), 2 µM ICA (solid curve; same as data plotted in B), 5 µM ICA (○), and 10 µM ICA (◇). For reference, the voltage dependence of hEAG1 activation (B) is replotted as a dashed curve. For control inactivation, V0.5 = −82.6 ± 2.6 mV and z = 1.26 ± 0.36 (n = 16). For 5 µM ICA, V0.5 = −80.0 ± 4.4 mV and z = 1.65 ± 0.27 (n = 5); for 10 µM ICA, V0.5 = −89.5 ± 4.7 mV and z = 1.39 ± 0.17 (n = 7). (E) Plot of the voltage dependence of hEAG1 control activation and inactivation after 2 µM ICA. For inactivation, minimum and maximum Imax was set to 0 and 1, respectively.

