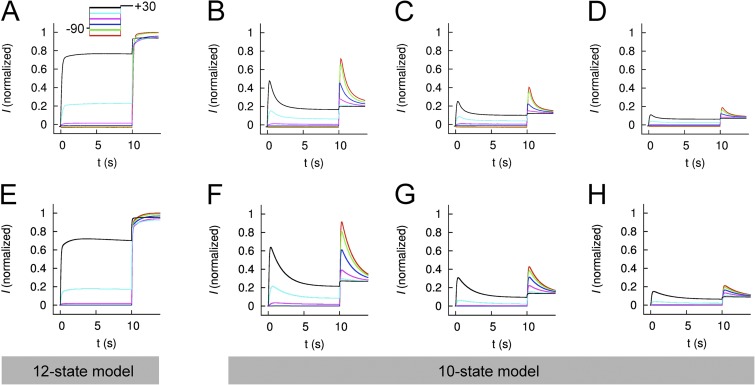
Figure 11.
Comparison of measured and modeled currents for WT hEAG1. (A–D) Currents recorded from five to eight oocytes for each condition (Control [A] or ICA at 2 [B], 5 [C], and 10 µM [D]) were averaged and normalized to their corresponding peak control current. Voltage-pulse protocol: Vh = −90 mV and Vpre (10 s) ranged from −130 to +20 mV, applied in 30-mV increments; at 10 s, a test pulse to +30 mV was applied. (E–H) Simulated EAG currents (I) for control (E, 12-state model) and in the presence of 2 (F), 5 (G), and 10 µM (H) ICA (all 10-state models).

