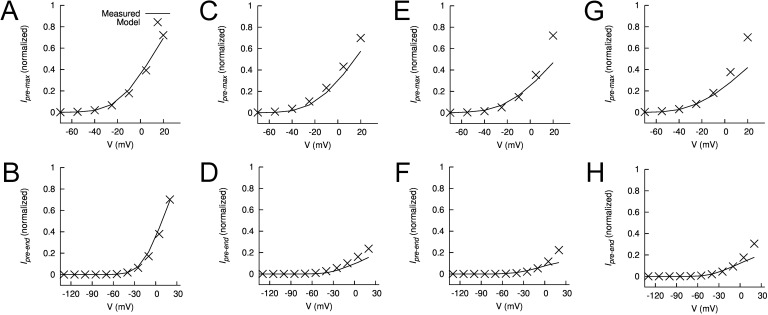
Figure 12.
Features of measured and modeled WT hEAG1 current during prepulses. (A–H) Plots of normalized maximum (Ipremax) and end (Ipreend) currents during the prepulse for control (A and B) in the presence of 2 (C and D), 5 (E and F), and 10 µM ICA (G and H). In each panel, experimentally measured currents (curves) are compared with modeled currents (X), all normalized to their respective Imax (peak current at Vt of +30 mV).

