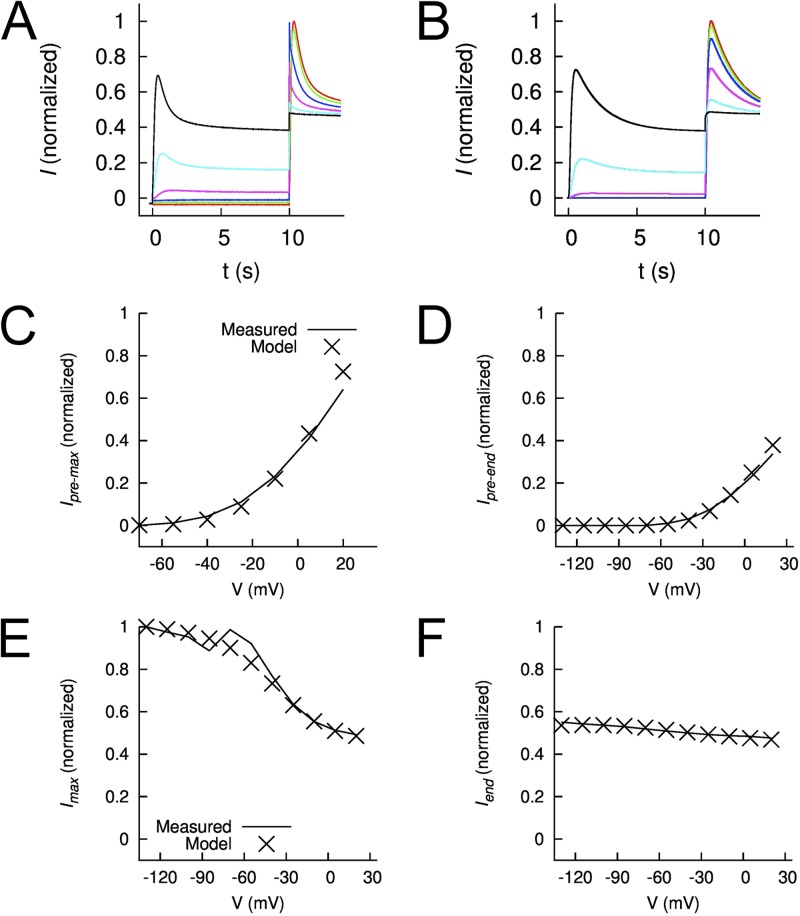
Figure 14.
Comparison of measured and modeled currents of Y464A hEAG1. (A) Currents recorded from 10 oocytes were averaged and normalized to Imax. Voltage-pulse protocol: Vh = −90 mV and Vpre (10 s) ranged from −130 to +20 mV, applied in 30-mV increments; at 10 s, a test pulse to +30 mV was applied. (B) Simulated EAG1 currents (I) for Y464A hEAG1. Features of the currents were extracted during the prepulse (C and D) and test pulse (E and F). In each panel, experimentally measured currents (curves) are compared with model currents (X), all normalized to their respective Imax.

