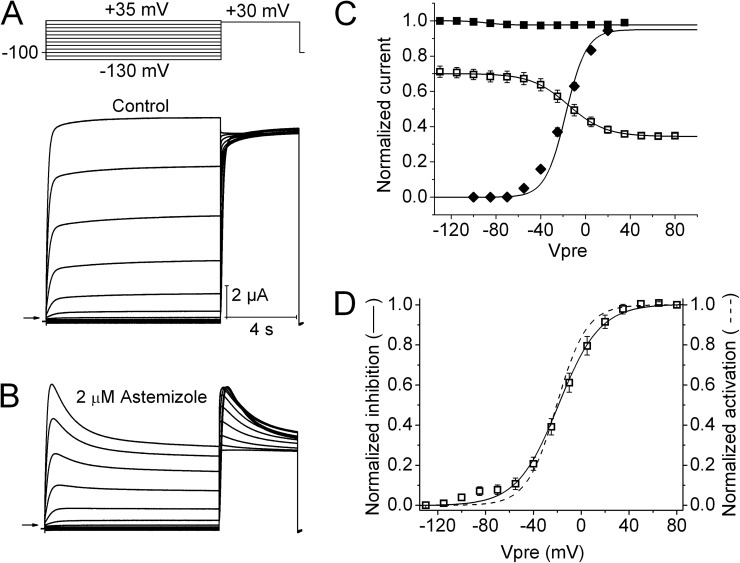
Figure 2.
Voltage-dependent hEAG1 channel block by astemizole. (A) Control hEAG1 currents (bottom) elicited with voltage-pulse protocol shown in the top. Vh was −100 mV, and Vpre was 10 s in duration and ranged from −130 to +35 mV, applied in 15-mV increments. (B) Currents recorded from the same oocyte after steady-state block by 2 µM astemizole. (C) Voltage dependence of hEAG1 activation (◆) and inactivation (■) in control, and inhibition by 2 µM astemizole (□). For inactivation and inhibition curves, normalized Imax was plotted as a function of Vpre. For the activation curve, Ipre normalized for electrical driving force was plotted as a function of Vpre. Data (n = 5) were fitted with a Boltzmann function (curves). For control inactivation, V0.5 = −88.5 ± 2.4 mV and z = 2.84 ± 0.62; for control activation, V0.5 = −17.8 ± 1.4 mV and z = 1.84 ± 0.01. For inactivation in the presence of astemizole, V0.5 = −15.7 ± 3.3 mV and z = 1.51 ± 0.07. (D) Comparison of the voltage dependence of hEAG1 activation (dashed curve) and block by 2 µM astemizole (□).

