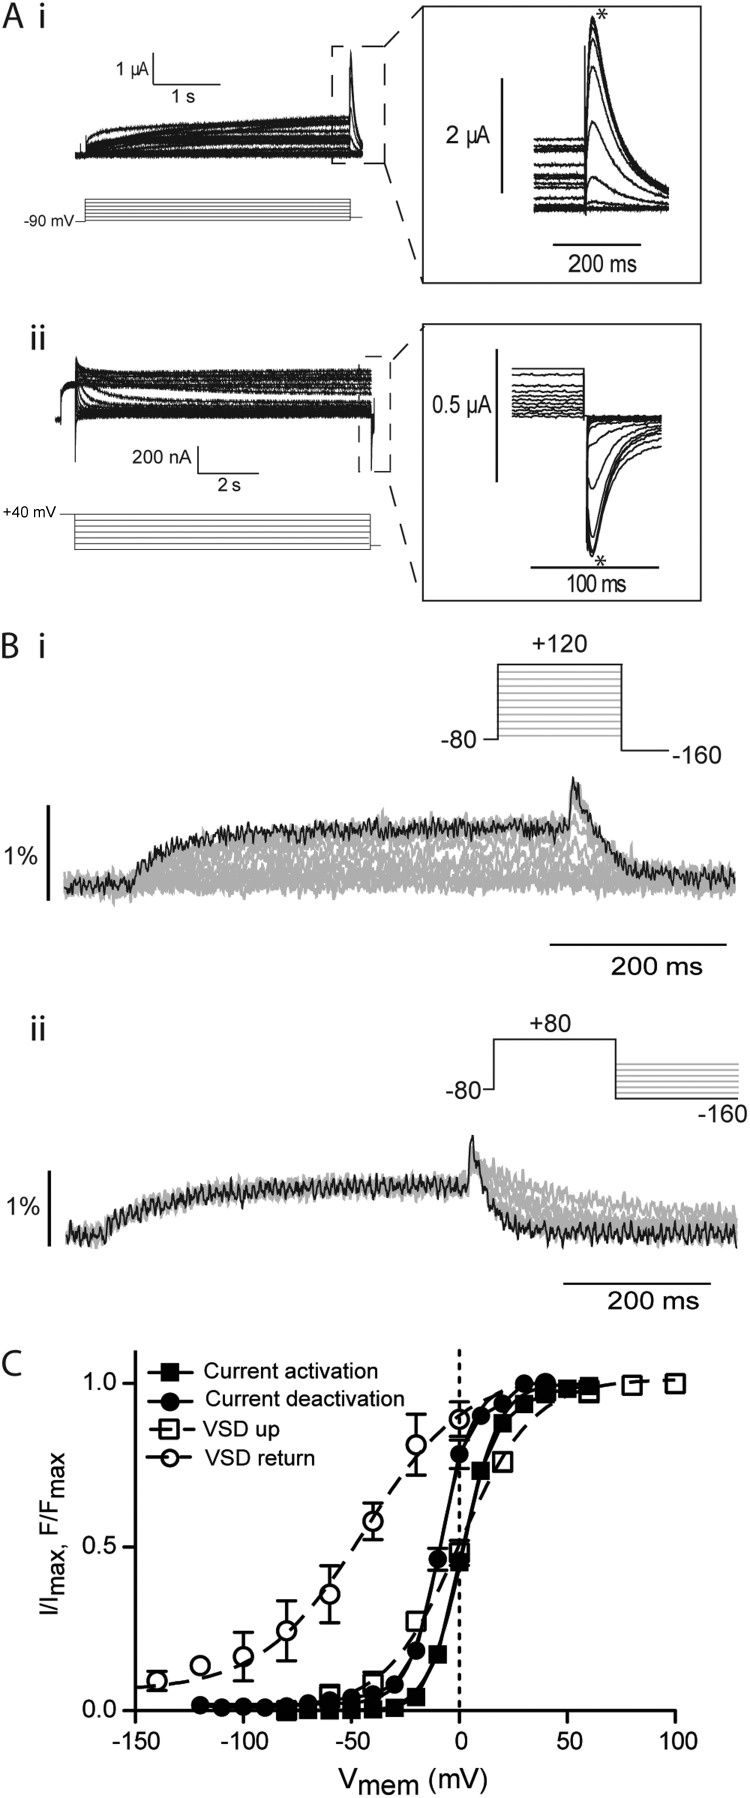
Figure 2.
Effect of N-terminal truncation on mode shift of hERG channels. (A) Example traces recorded in response to protocols shown to measure the voltage-dependent equilibria of activation (i) and deactivation (ii) of Δ2–25 hERG channels. Insets are expansions of the highlighted regions. Peak currents were measured at the points marked with asterisks. (B) Example fluorescent traces recorded using voltage-clamp fluorometry in response to the protocols shown to measure activation/upward motion (i) and return (ii) of the VSD of Δ2–25 hERG. (C) Summary of voltage dependence of equilibria of activation and deactivation. Solid lines are fits of the Boltzmann equation to current data, whereas broken lines are fits of the Boltzmann equation to the fluorescent data. V0.5 values were 2 ± 0.3 mV and −10 ± 0.4 mV for current activation and deactivation, respectively (SEM; n = 7). V0.5 values were measured as 0 ± 1 mV (SEM; n = 8) and −43 ± 7 mV (SEM; n = 11) for activation and return of the VSD, respectively.

