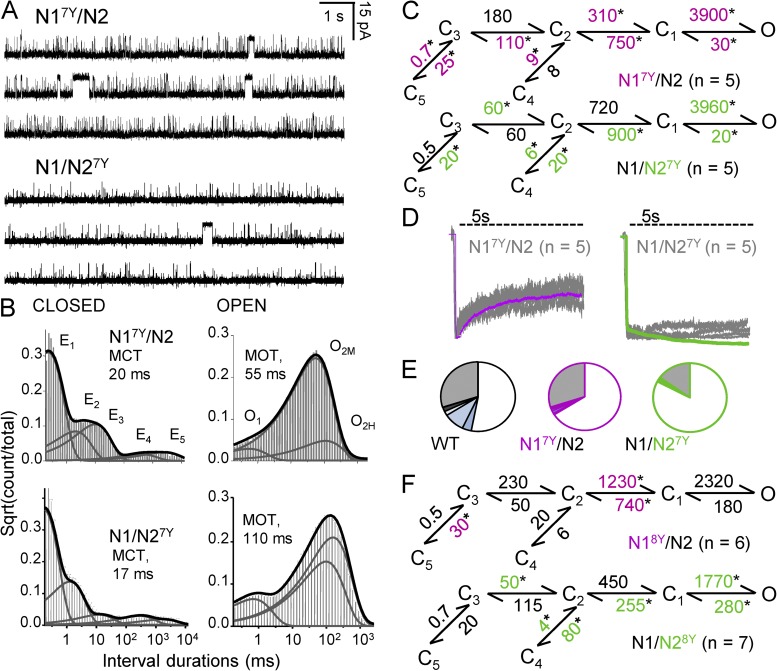
Figure 3.
Gating mechanism of A7Y and A8Y NMDA receptors. (A) Continuous 30-s traces produced by one N17Y/N2 (top) or one N1/N27Y receptor (bottom); open is down. (B) Dwell-time histograms for the records shown in A; overlaid are probability density functions calculated with a 5C3O model (thick line) and kinetic components (thin lines). (C) Reaction mechanisms derived from fits to the entire event sequence in each file; rate constants (s−1) are given as the rounded mean for each dataset. *, significant differences relative to WT (P < 0.05; Student’s t test). All states (C, O) represent fully liganded (2 Glu, 2 Gly) receptors. (D) Whole-cell responses to 5-s applications of 1 mM Glu were recorded from multiple cells (gray) and are superimposed with traces simulated with models in C (purple and green). (E) Occupancy plots calculated from the corresponding models in C. (F) Reaction mechanisms derived from records produced by NMDA receptors with A8Y substitutions.

