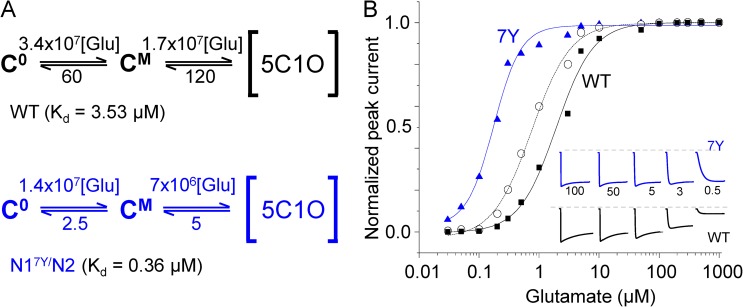
Figure 5.
N17Y/N2 NMDA receptors have increased affinity for glutamate. (A) Reaction schemes include explicit glutamate-binding steps appended to the [5C1O]-liganded sequences represented in Figs. 2 C (WT, black) and 3 C (A7Y, blue). At all times receptors are fully occupied with glycine. Rate constants for WT (top) are from Popescu et al. (2004); rate constants for N17Y/N2 (bottom) were estimated from global fits to records obtained in high glycine concentrations (0.1 mM) and three separate low glutamate concentrations (0.5, 1, and 3 µM; n = 2 for each). Except for the association rate constants, which are in M−1s−1, all others are in s−1. (B) Dose–response curves were calculated for WT (▪) and N17Y/N2 (▴) receptors from responses generated with the kinetic models illustrated in A, and again for N17Y/N2 receptors (○) with the 5C1O model in Fig. 3 C and assuming glutamate-binding rates reported for WT (A, top). Inset illustrates simulated macroscopic traces used to construct the dose–response curves.

