Figure 6.
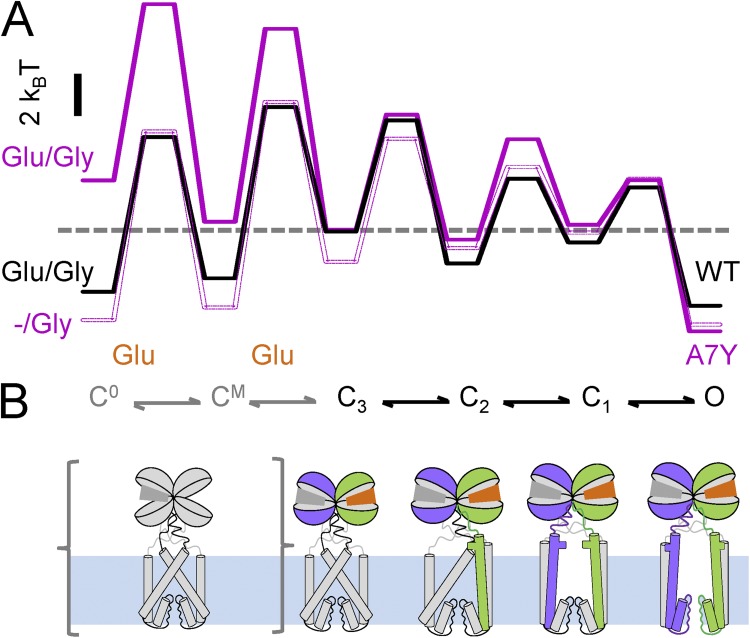
Proposed NMDA receptor activation sequence. (A) Free energy profiles for WT (black) and A7Y (purple) were calculated from the kinetic models given for WT in Fig. 5 A, constitutive N17Y/N2 gating (dotted line) in Fig. 4 C, and glutamate-activated gating (filled line) in Fig. 5 A; the resulting traces were aligned based on the measured differences in open-state stabilities for the three conditions. (B) A possible sequence of structural changes that accompany NMDA receptor activation and its correspondence to the rate-limiting steps identified in single-molecule traces; for clarity, desensitization steps are omitted. Only one glycine-bound heterodimer is represented, and NTD, M1, and CTD modules are omitted. The reaction is initiated from the glycine-bound resting state (C0, gray) and proceeds toward active conformations represented in purple for N1 and green for N2.

