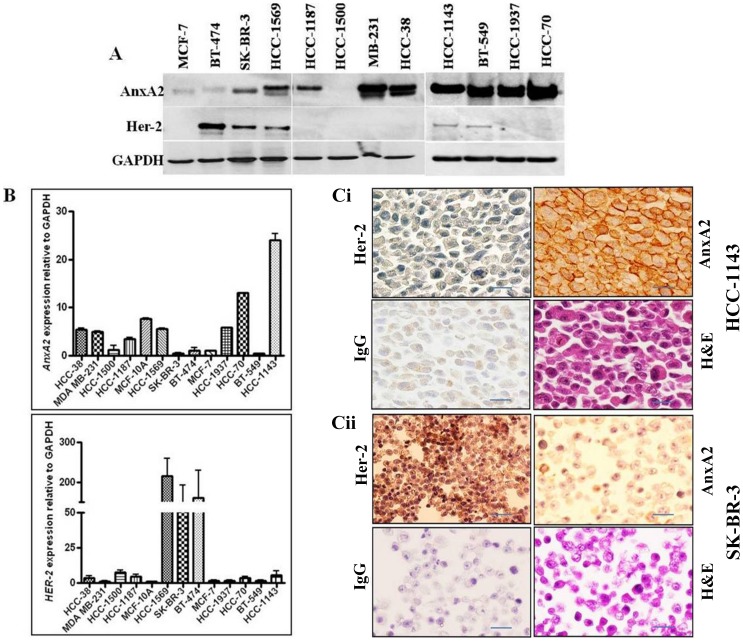
Figure 2. AnxA2 and Her-2 expression in breast cancer cell lines.
(A) AnxA2 and Her-2 protein was analyzed by Western blotting in a breast cancer cell lines panel including Her-2 amplified SK-BR-3, BT-474 and HCC-1569; Her-2 null/negative HCC-38, HCC-1143, MDA-MB-231, BT-549, HCC-70, HCC-1937 and ER expressing HCC-1187, MCF-7 and HCC-1500. Glyceraldehyde-3-Phosphate Dehydrogenase (GAPDH) was used as loading control. (B) qPCR analysis showing mRNA expression of AnxA2 and Her-2 in breast cancer cell lines. Total RNA isolated from different breast cancer cell lines were reverse transcribed and then cDNA samples were PCR amplified. The amplification of AnxA2 was compared against the endogenous control GAPDH. The numbers shown are quantitative fold change. (C) Immunohistochemical analysis of AnxA2 and Her-2 in paraffin embedded HCC-1143 (i) and SK-BR-3 (ii) cell clots. Paraffin embedded blocks with cell clots were cut into serial 5 µM sections and were mounted onto superfrost TM adhesive-coated slides. The slides were processed for immunohistochemistry using AnxA2 (BD Biosciences, CA) and Her-2 (Cell Signaling, MA) antibodies. Mouse IgG was used as negative control. Immunostaining was performed with a kit from Vector laboratories using DAB solution. All images are 100X original magnification. All the three analyses, Western blot, qPCR analysis of mRNA and immunohistochemical analysis revealed that expression of AnxA2 is higher in breast cancer cells which express null/basal Her-2. (Scale bar = 50 µm).

