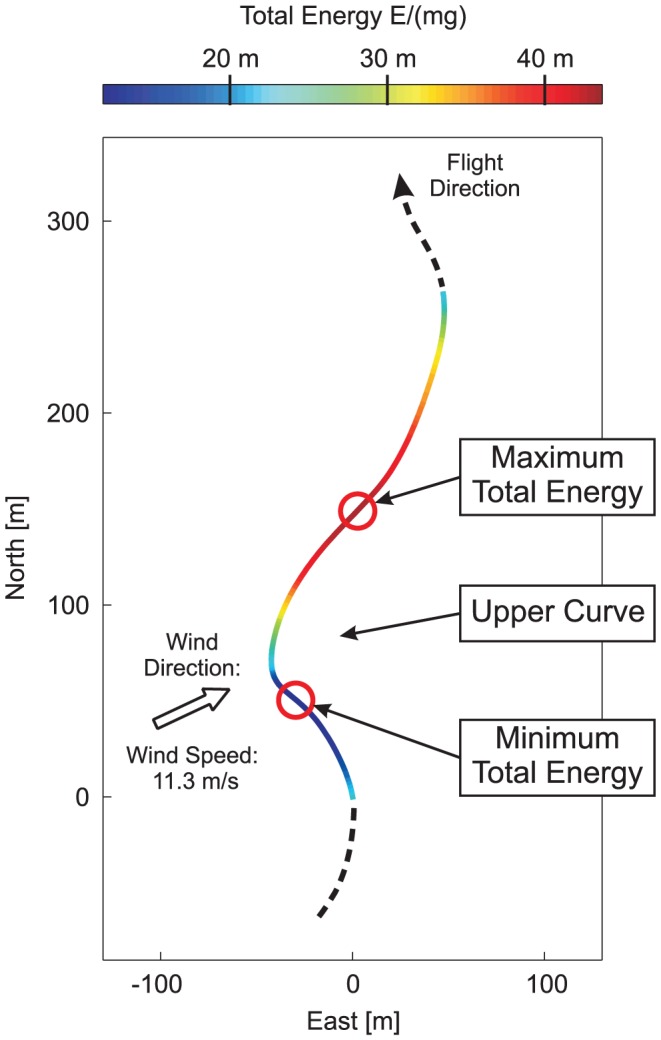
Figure 3. Total energy mapped to flight trajectory (for the cycle from Fig. 1c ).

The total energy,  , is indicated by colour coding. Quantification is possible with reference to the bar (at the top) which establishes a relation between colour and total energy. The energy gain is achieved in the part of the curve where the colour changes from blue to red. The total energy reaches a maximum at the end of the upper curve, after the bird has changed its flight direction from wind- to leeward (dark-red colouring). Thereafter, the total energy begins to decrease and reaches a minimum past the lower curve where the bird has changed its flight direction from lee- to windward. Both the minimum and the maximum total energy states correspond with the ones in Figs. 2a and 2b (as indicated by red cycles in each Fig.). The coloured part of the trajectory coincides with the time span of the diagrams in Fig. 2. The depicted trajectory part shows an error drift of 1.5 cm/s yielding an estimated bias of 23 cm at the end of the cycle. The direction and the speed of the wind are also indicated. The wind speed holds for 10 m altitude.
