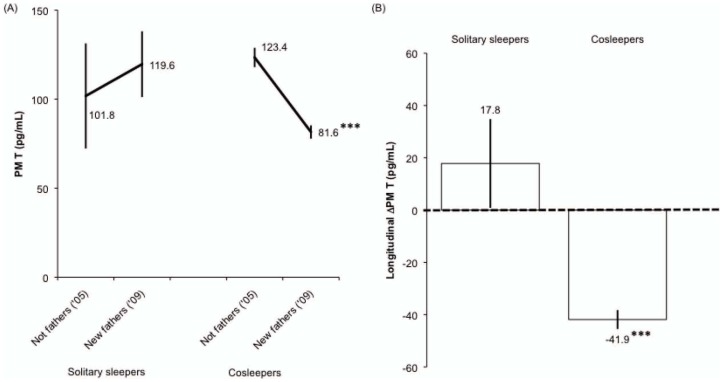
Figure 3. A–B: Changes in PM T between baseline (2005) and follow-up (2009).
Analyses were restricted to men who transitioned from being non-fathers in 2005 to parents in 2009. Values are adjusted for time of saliva collection, stratified according to whether fathers were solitary sleepers (n = 9) or cosleepers (n = 200). Statistical comparisons reflect that cosleeping fathers had a significantly greater decline in PM T compared to solitary sleeping fathers. *** p = 0.001. Error bars indicate s.e.m.

