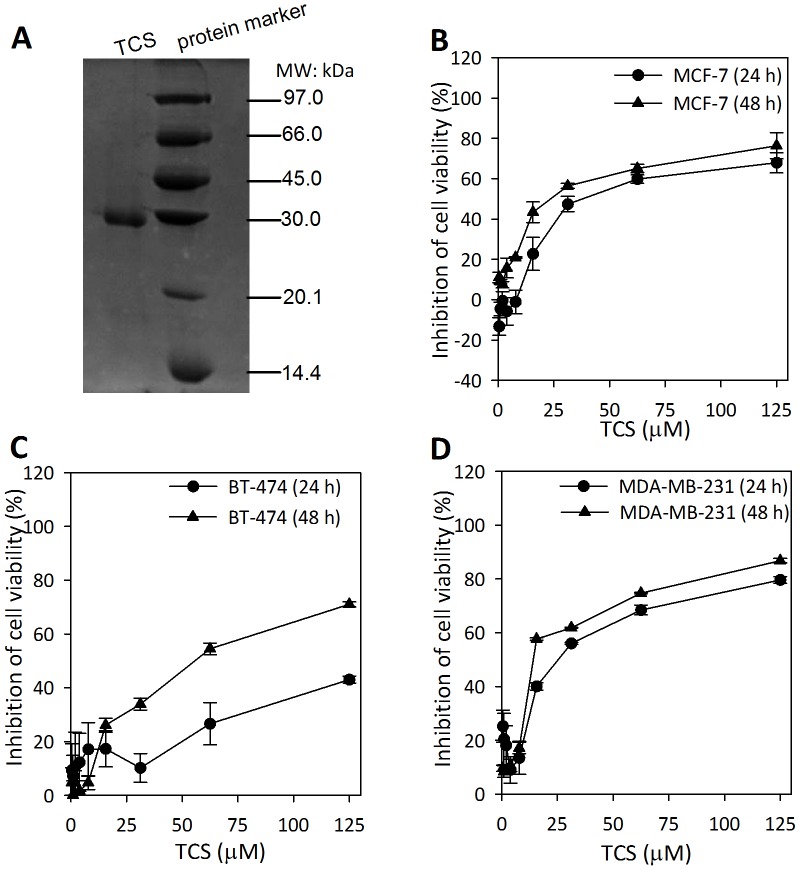
Figure 1. Effect of TCS on the viability of different breast cancer cells.
A. The isolated TCS manifested a single band with a molecular mass of 27-kDa. B–D. MCF-7, BT-474, and MDA-MB-231 cells were cultured in the presence of different concentrations of TCS (ranging from 0.49 to 125 µM) for 24 h to 48 h. The remaining cell viability was measured by MTT assay. The results are shown as means ± S.D. of two independent experiments performed in triplicate.

