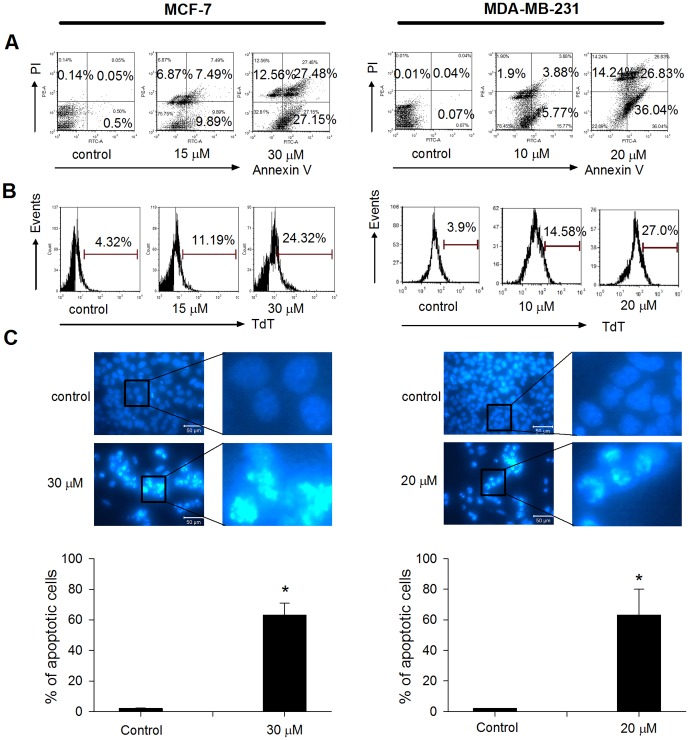
Figure 3. TCS-induced apoptosis in breast cancer cells.
A. Cells were treated with TCS at the indicated concentrations for 24 h. Cells were harvested and subsequently stained with Annexin V/PI solution for cell sorting under flow cytometry. Percentages of cells undergoing early apoptosis (right lower quadrant) and late apoptosis (right upper quadrant) were analyzed by FCS Express 4 software. B. Cells were treated with TCS at the indicated concentrations for 24 h, and cells with DNA fragmentation were detected by flow cytometry following TUNEL staining. C. Cells were treated with TCS at the indicated concentrations for 24 h, and nuclear morphological changes were examined by staining with Hoechst 33342 and fluorescence microscopy. Bars, 50 µm. In each panel of Fig. 3C, figures on the right represented fourfold magnification of the rectangular zones in figures on the left.

