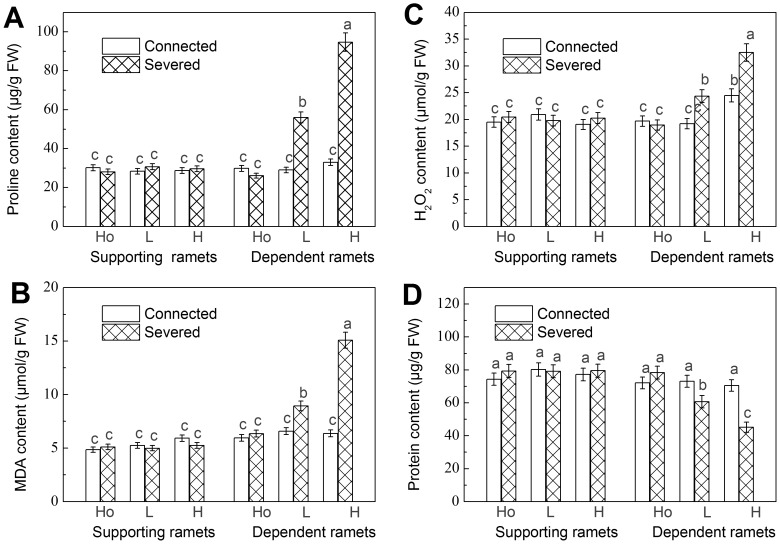
Figure 2. Osmolytes and ROIs.
(A) Proline content, (B) MDA content, (C) H2O2 content and (D) protein content of the supporting and the dependent ramets. Data are means±SE (n = 15). Bars sharing the same lowercase letter are not different at p = 0.05. Treatments are coded as in Table 1.

