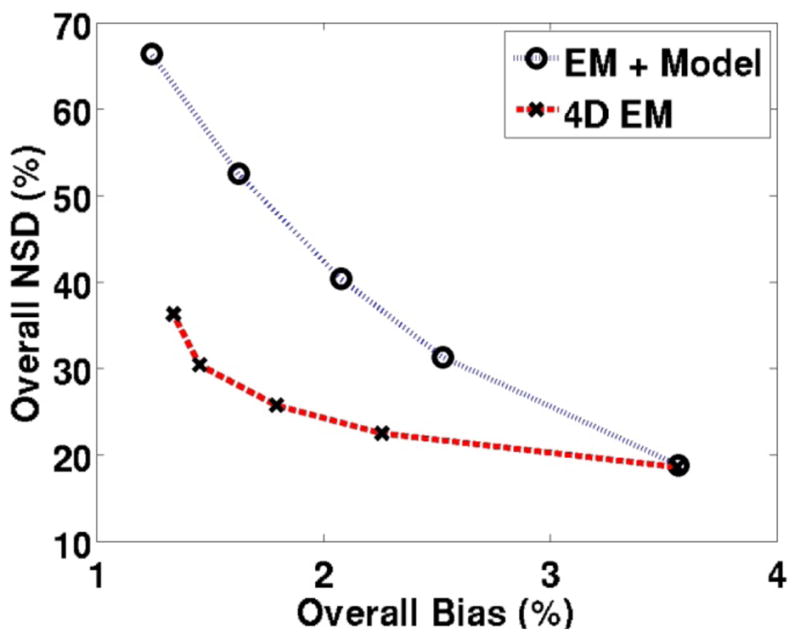
Figure 6.

Plots of overall NSD (noise) vs. overall bias comparing parametric DV images obtained from standard indirect method (EM reconstruction followed by modeling) as well as the proposed direct 4D technique. The plasma input model was used. Points on each curve (right to left) correspond to the images of increasing iterations in each row of figure 5.
