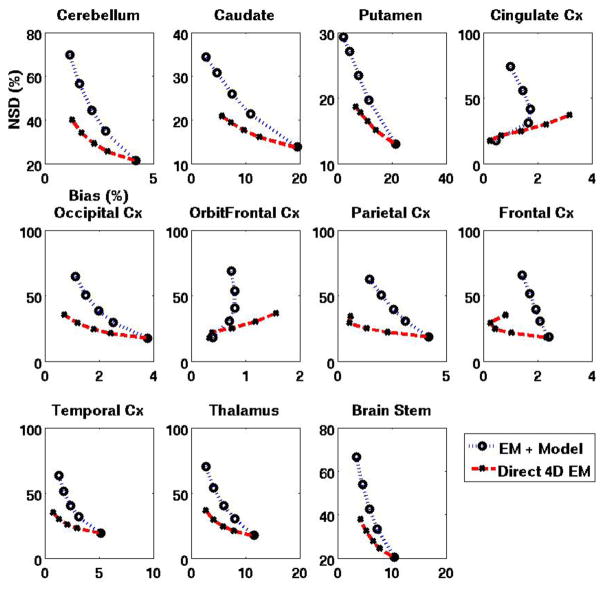
Figure 7.
Plots of NSDROI (noise) vs. BiasROI for DV images obtained using standard EM and the proposed direct 4D EM technique (plasma input model). Points on each curve correspond to the images in each row of figure 5. The actual DV values for the 11 regions (cerebellum to brain stem, in the order shown) were 0.298, 1.151, 1.398, 0.364, 0.365, 0.351, 0.359, 0.328, 0.377, 0.443 and 0.403, respectively (this implies DVR values of 1, 3.865, 4.694, 1.222, 1.226, 1.179, 1.206, 1.102, 1.264, 1.488 and 1.3517, respectively). Also, the actual intercept B values were −0.973, −29.80, −40.37, −2.34, −3.04, −2.14, −2.83, −1.62, −2.76, −2.62 and −5.98 for the plasma input model, and for the reference tissue model θ, they were 0, −76.98, −105.8, −3.39, −5.47, −2.92, −4.90, −1.60, −4.52, −3.47 and −13.77, respectively.

