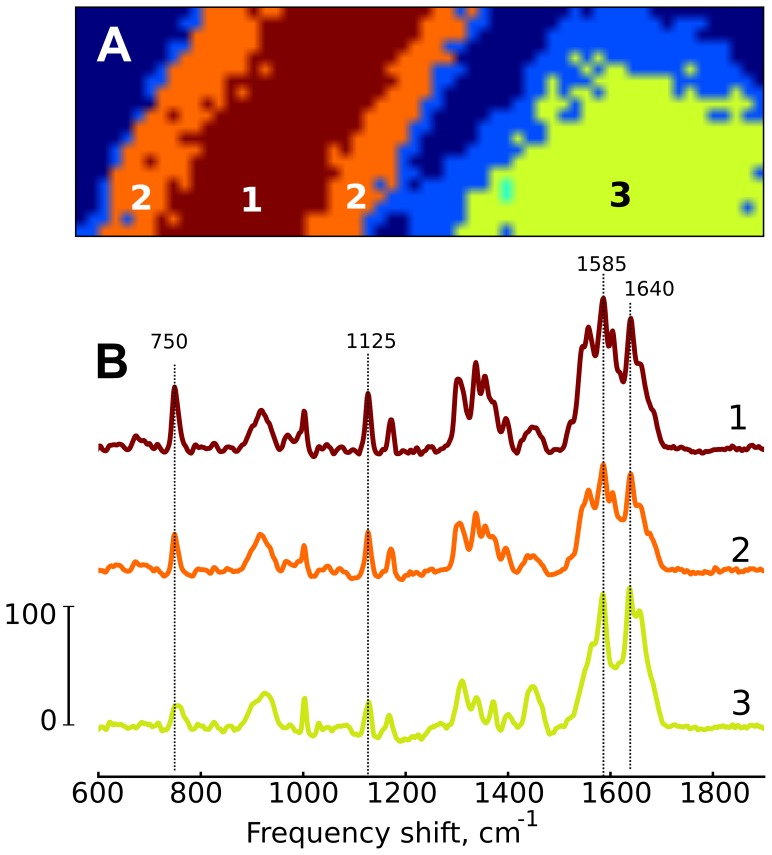
Figure 3. Raman cluster analysis.
(A) Cluster maps of rod- and round-shaped cardiomyocytes from Fig. 2 A Each color corresponds to the individual cluster consisting of pixels that were defined to have similar Raman spectra. (B) Averaged Raman spectra for each cluster. Spectrum color and number correspond to the color and number of its cluster in panel A.

