
Figure 2.
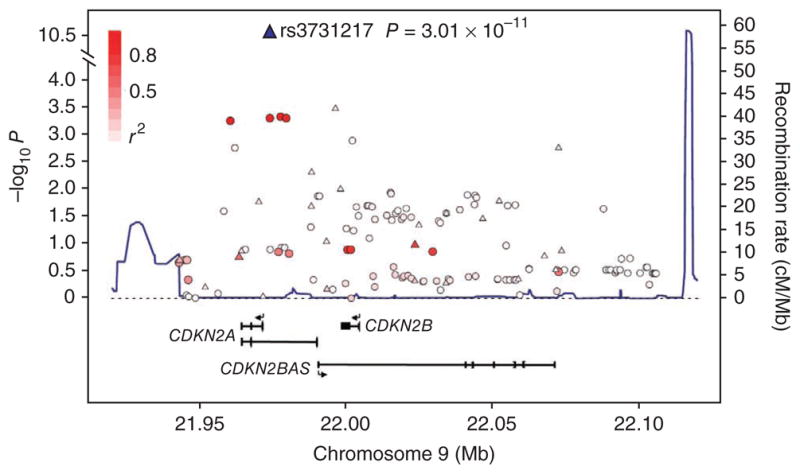
LD structure and association results for the 9p21.3 ALL locus. The local recombination rate is plotted in dark blue over this 174-kb chromosomal segment. Armitage trend test P values (as −log10 P values along the left y axis; note the broken axis between 4.0 and 10.5) are shown for the SNPs analyzed. Each triangle represents a SNP genotyped in the GWA study, circles represent imputed SNPs, and the most associated SNP in the combined analysis, rs3731217, is marked by a triangle (blue in combined analysis). The color intensity of each □ reflects the extent of LD with rs3731217, indicated by red (r2 > 0.8) going to white (r2 < 0.2). Physical positions are based on NCBI build 36 of the human genome. Also shown are the relative positions of genes mapping to each region of association. Exons of genes have been redrawn to show the relative positions in the gene, and therefore maps are not to physical scale.