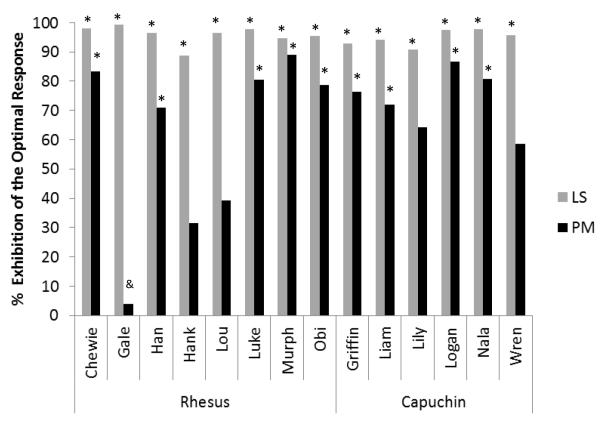
Figure 2.
Test performance with 10% prospective memory (PM) blocks. The y-axis represents the percentage of total trial-blocks in which monkeys made a PM or learning-set (LS) icon selection when each was the optimal response. The two bar colors represent the different response types. An asterisk or ampersand above a given bar signifies that the optimal response was executed significantly more often or less often than chance (50%), respectively, as assessed by a two-tailed binomial test with an alpha level of .05.

