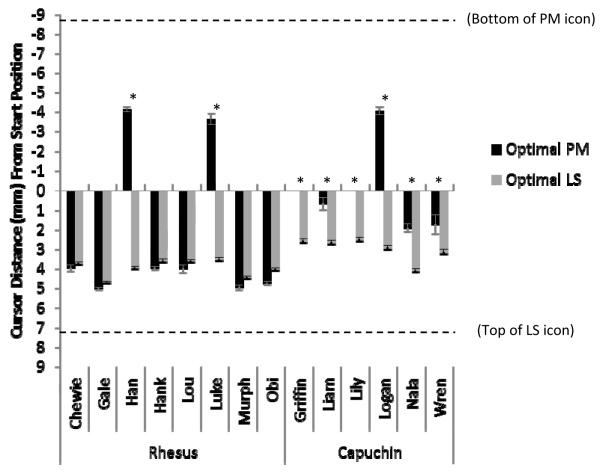
Figure 3.
Cursor position when the prospective memory (PM) icon appeared in 10% PM test blocks. The y-axis represents the mean distance (in mm) between the cursor at start of trial and the cursor three seconds later when the PM icon appeared. The two different bar colors represent trials in which the monkeys ultimately selected the PM and learning-set (LS) response icons when each was the optimal response. The two dashed lines represent the vertical position of the two response icons. Error bars represent the standard error of the mean. An asterisk above a pair of bars signifies a significant difference (in the predicted direction) in cursor position between the two trial types as assessed by a two-tailed independent samples t-test with an alpha level of 0.05 (see also Table 1).

